Evaluation of the ASTER GDEM v2 data set
In October 2011 the Japanese ![]() METI
and the US
METI
and the US ![]() NASA released a new global elevation data set – the ASTER GDEM v2.
This data replaces a previously released version 1 data set which was much lower quality and therefore less usable. Here i want to analyze the usability of this new data set for visualization purposes.
NASA released a new global elevation data set – the ASTER GDEM v2.
This data replaces a previously released version 1 data set which was much lower quality and therefore less usable. Here i want to analyze the usability of this new data set for visualization purposes.
Apart from this text you might want to have a look at the technical documentation of the data set on the websites linked above and in the bibliography below as well as Jonathan de Ferranti's review of this data if you are interested in using this data.
Some background information
Back in 2000 NASA created and made publicly available the first elevation data set with a globally uniform standard of quality by means of the ![]() SRTM mission. Previously available elevation data has been of strongly varying quality in different regions of the world and attempts to combine these sources into a global data set like
SRTM mission. Previously available elevation data has been of strongly varying quality in different regions of the world and attempts to combine these sources into a global data set like ![]() GTOPO30 were limited to low resolution and could not even provide this standard in some regions of the world.
GTOPO30 were limited to low resolution and could not even provide this standard in some regions of the world.
SRTM data was released in a comparitively high resolution of 3 arc seconds (~90m at the Equator) and since it has been collected from space quality was uniform over the whole area of coverage. It had two major disadvantages though:
- Coverage is not truly global – due to the orbit of the space shuttle it is limited to latitudes between about 60 degree north and south.
- The data set contains major holes i have discussed in detail elsewhere due to the method of data acquisition used.
Despite these shortcomings SRTM has been the major source of elevation data for all sorts of applications for the past ten years. Jonathan de Ferranti has put a major effort in filling the voids and the polar region gaps from alternative sources.
The GDEM data
The ASTER GDEM data set i am going to discuss here is quite similar in scope and potential applications – with the following major differences:
- The elevation information is not obtained through radar interferometry but by analysis of stereo image pairs - the principle is described in more detail in the technical documentation linked above. As a result of this it does not suffer from the same voids as the SRTM data, it is however subject to obstruction by cloud cover.
- Due to the different orbit of the satellite data also covers higher latitudes (up to 83°) including nearly all land masses in the north and everything but the southmost part of Antarctica – although there are larger voids on the inland ice.
- The data set is published with a nominal resolution of 1 arc second which is three times the linear resolution of the SRTM version which has been published globally.
- While the SRTM data set is in the public domain and free to use by anyone for any purpose the GDEM data set is made available under
 somewhat obscure terms you have to agree to when downloading. As a result of this the data is not openly available through public FTP but has to be downloaded through the services linked to from the NASA site mentioned above.
So much for the formal differences, which would lead one to conclude that this data cannot be only used to fill the voids in the SRTM data set but that it could be of benefit for a lot of applications in areas where SRTM is available as well due to the higher resolution compared to SRTM. The question is if the actual data lives up to this expectation.
The data quality – resolution and noise
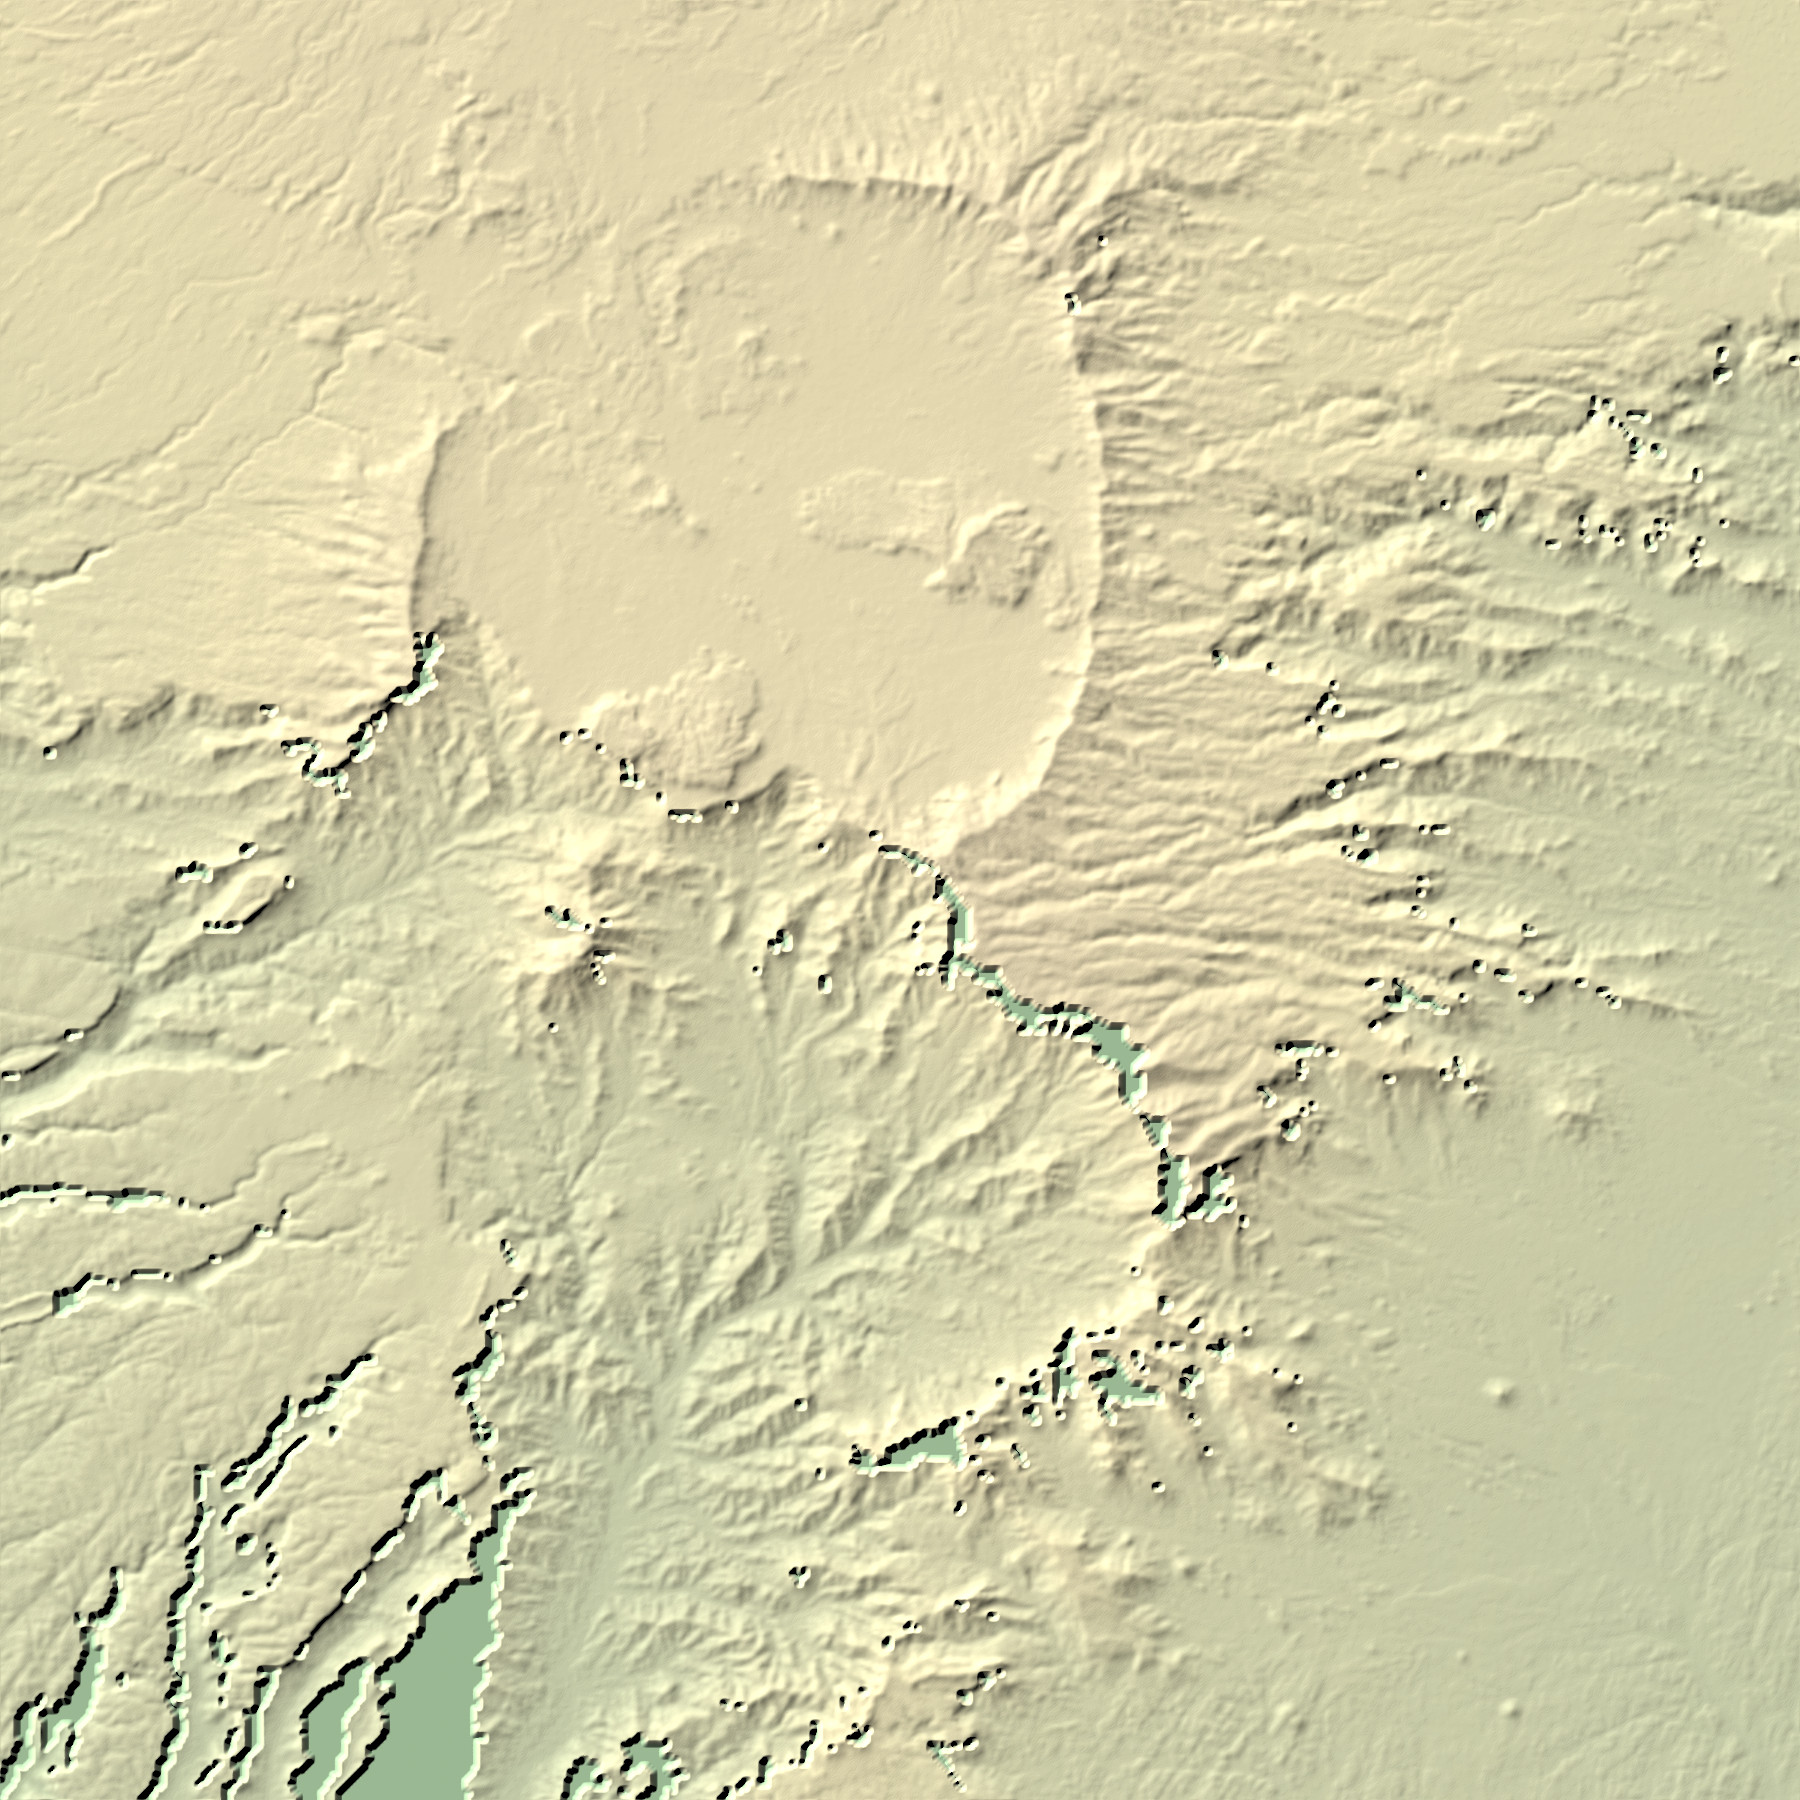
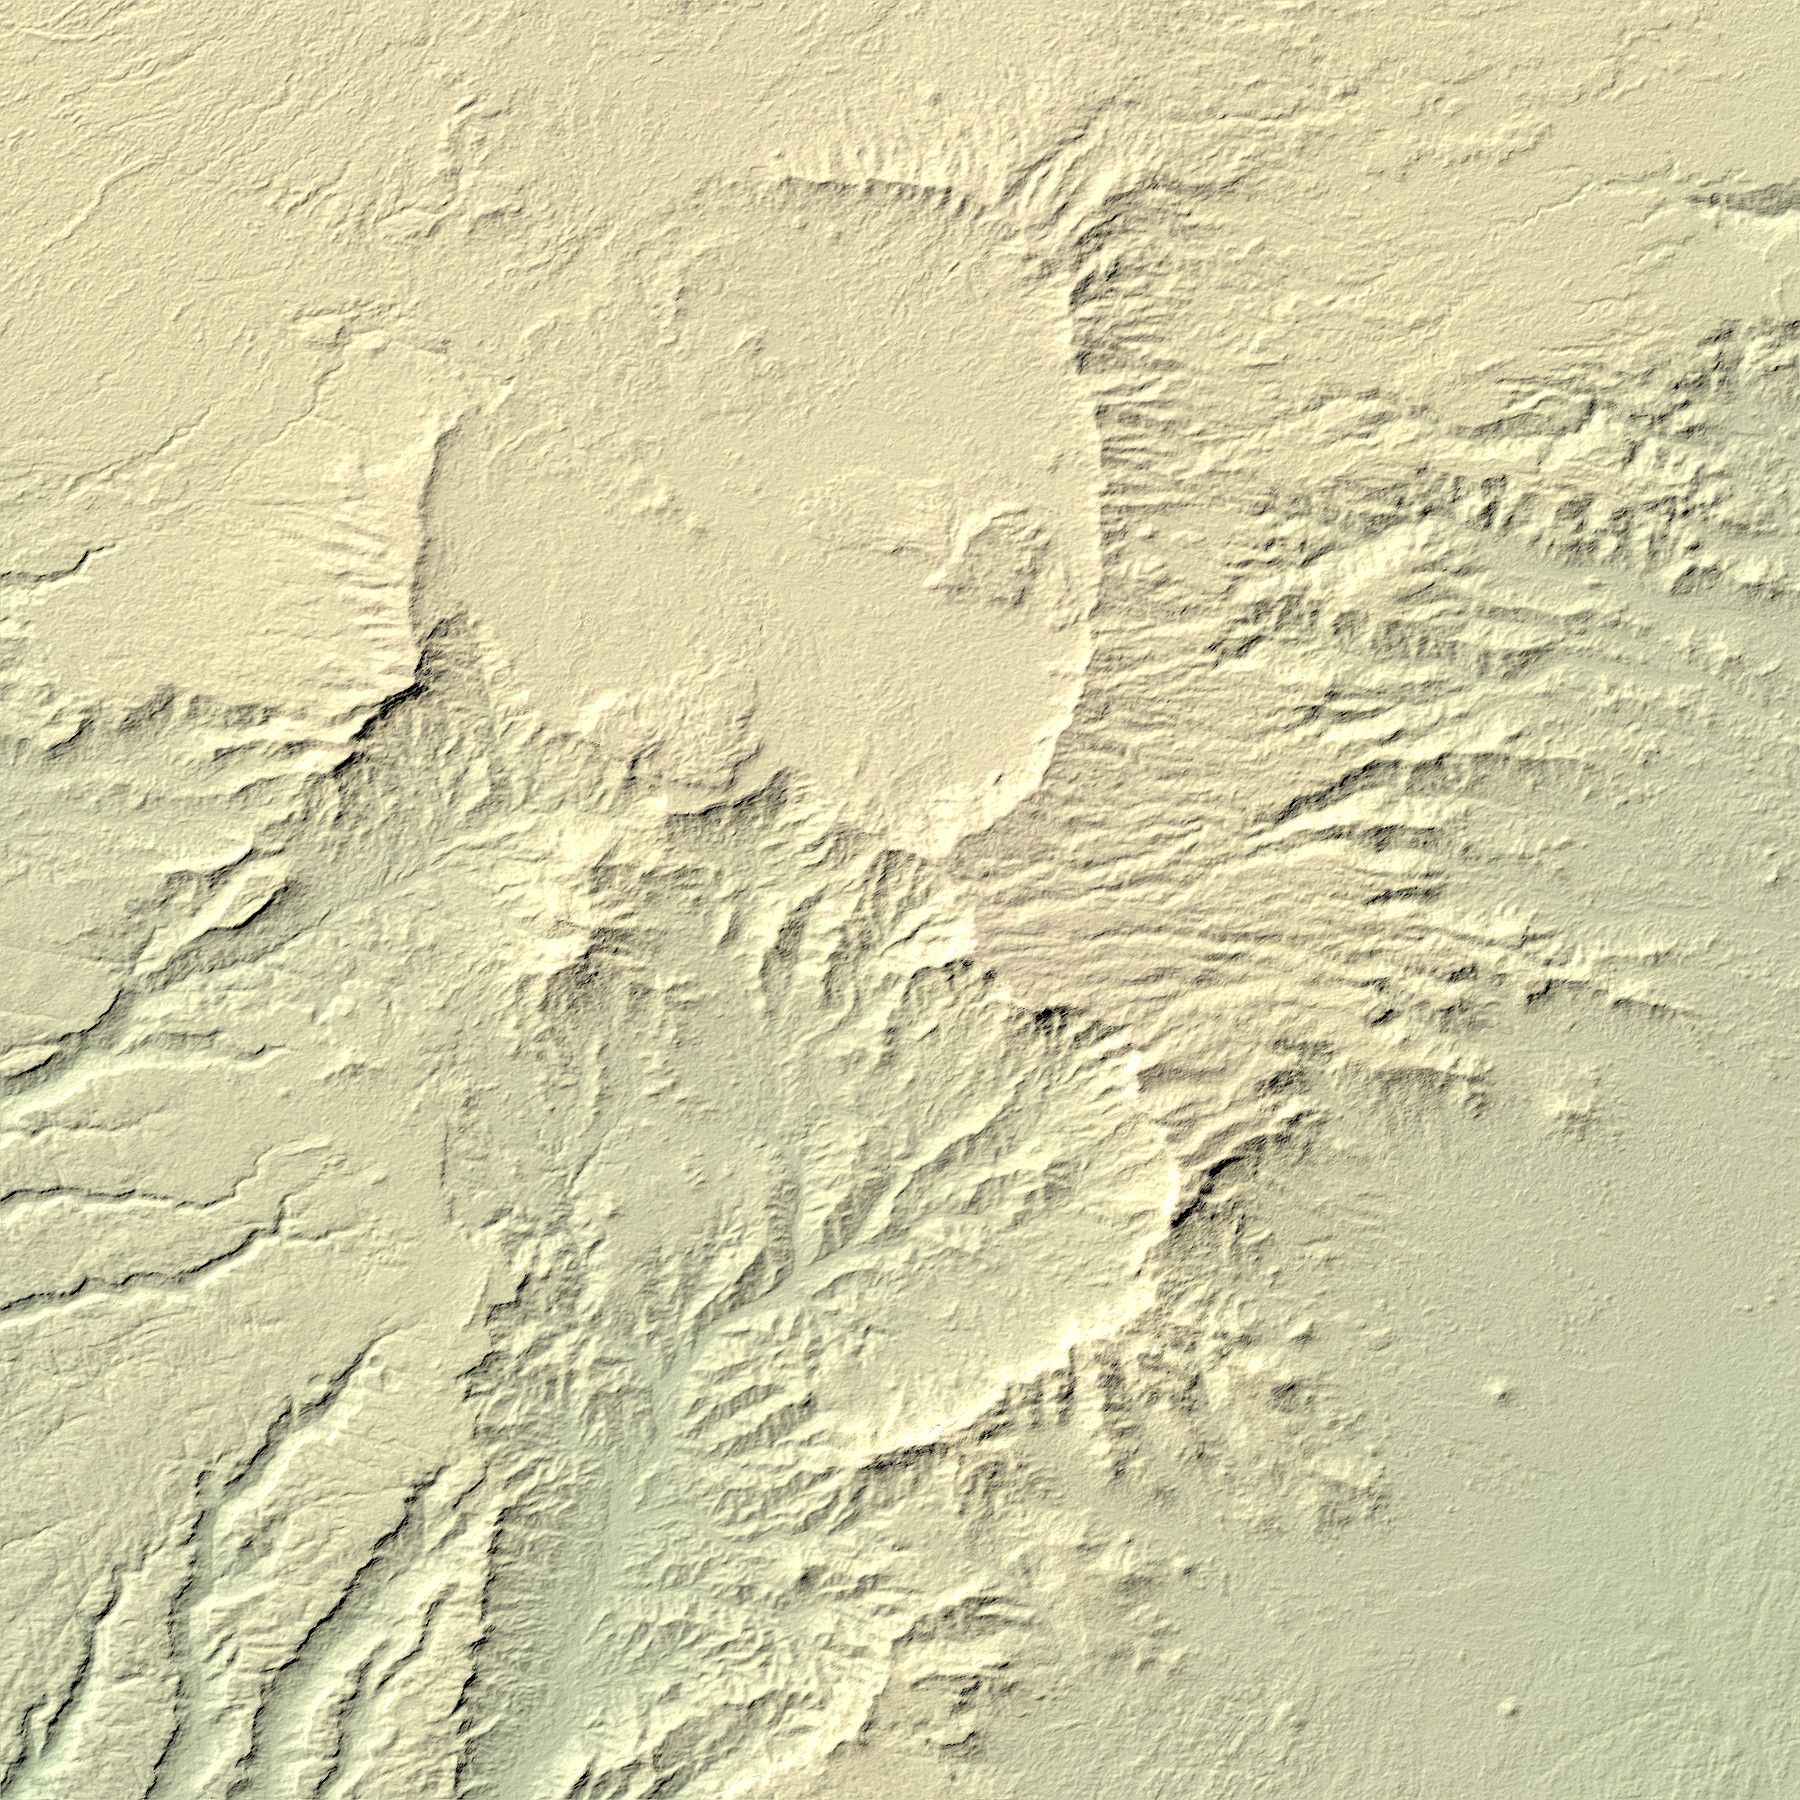
I have already pointed out above that in contrast to the radar based acquisition of SRTM the method used for ASTER GDEM is disturbed by cloud cover. Therefore i will first have a look at data in an area where cloud cover is not much of a problem. The following crops of shaded relief are from near 21° north, 17° east in the Tibesti mountains.
|
|
| SRTM DEM scaled up to 1 arc second resolution | ASTER GDEM |
The first impression is that the GDEM data contains strongly visible noise. This is best to quantify in a flat region where there is no significant actual elevation variation. Using a 0.1×0.1° region at 16.9° north, 17.6° east in the Bodele depression i measured a noise level of 6.2m RMS for the GDEM data and 1.6m for SRTM. Note the noise in both data sets is not completely random, it is colored and it is so in different ways in both data sets. Therefore these values can only give a rough idea of the actual noise levels. The shaded image above is not really well suited to characterize the noise so below you can see a color coded display of the elevation in the Bodele depression area. The color scale is the same in both images (covering 40m from black to white).

|
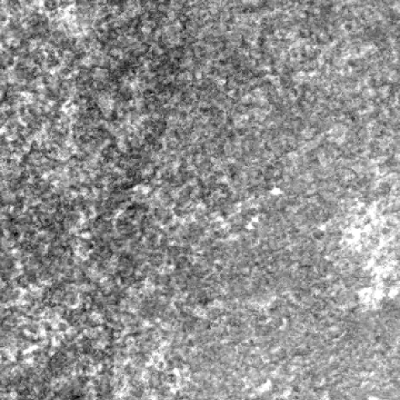
|
| SRTM DEM scaled up to 1 arc second resolution | ASTER GDEM |
Not all features visible are noise – there are some actual relief features even in this flat area. What can well be seen that in addition to the ASTER noise being stronger it has a much stronger high spatial frequency component which is what makes it very visible in the shaded display.
What is also interesting is that the ASTER GDEM documentation specifies an error of about 8 to 10m in regions of good coverage like this so the short wavelength noise visible in the 0.1° sample area above accounts for more than half of the total error. In comparison the vertical error in SRTM data has been determined to be about 5 meters (see the assessment report in the bibliography for details) of which high frequency noise would account for a much smaller fraction. It should be noted though that SRTM noise quite strongly varies depending on the type of ground.
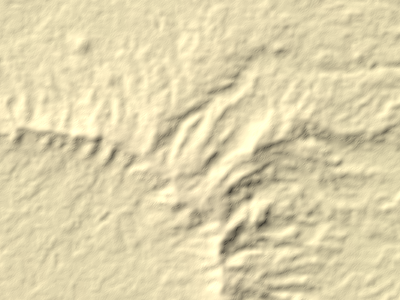
This noise of course means not all features we can see in the ASTER GDEM data which are not in the SRTM data are actual relief features. The question is if there actually is more detail under the noise. Noise suppression techniques as known from image processing are only of limited use here due to the spectral characteristics of the noise. None the less i did two tests you can see below: First i resampled the ASTER GDEM data to the SRTM resolution and scaled it up again. This can be seen on the left below. Second i applied a noise reduction algorithm to the data resulting in the image on the right when shaded.
|

|
| ASTER GDEM (resampled) | ASTER GDEM (noise reduced) |
As you can see both are very close to the SRTM data in resolution. The resampled data naturally does not feature significantly more detail than the SRTM data, at the same time noise is still visibly higher. The version with noise reduction applied on the other hand has a noise level lower than the resampled version although still higher than SRTM. It does show slightly more detail than both the resampled version and SRTM.
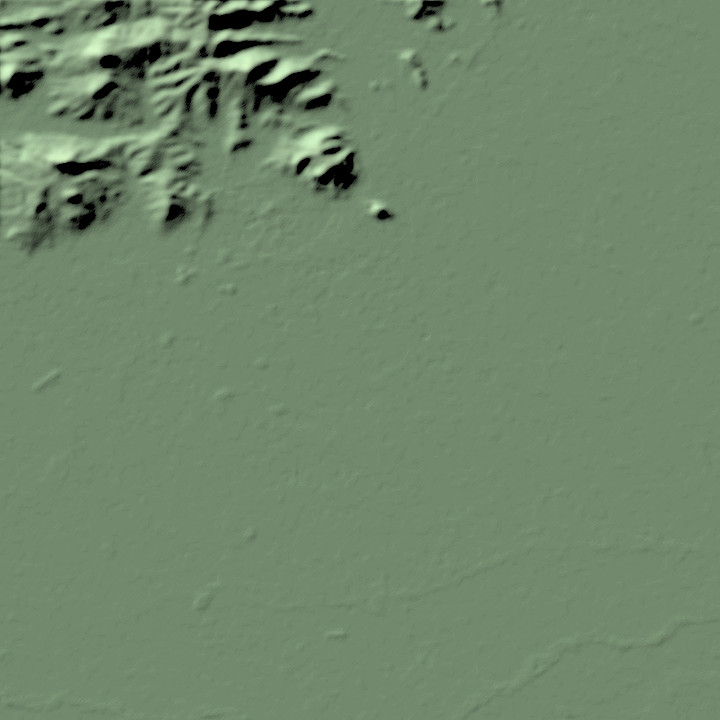
The question if there is more detail in the ASTER GDEM data under the noise is difficult to answer in the end. The detailed report linked in the bibliography below finds a resolution advantage compared to the 3 arc second SRTM. Since the noise amplitude is relatively constant and independent of the actual relief sharp edges will suffer less from the noise than less pronounced features. My analysis indicates there might indeed be a resolution advantage of the ASTER GDEM data with such sharp relief features in comparison to SRTM. At the same time it is possible that in flat terrain minor elevation differences which are detectable in SRTM data are buried below noise in ASTER GDEM data. On the other hand even in flat terrain the GDEM data clearly shows some larger scale features like dams which are not visible in SRTM as can be seen in the example below (near 45.2° north, 11.75° east). This illustrates quite well that a simple resolution value is insufficient to characterize the level of detail a data set offers in the presence of colored noise.
|
|
| SRTM DEM | ASTER GDEM with relief features not visible in SRTM |
Uniformity and errors
Until now i have only looked at data in regions where there cloud cover is not an issue. This is however only the case for a small part of the earth surface. Apart from clouds there are a few other aspects that affect reliability of the data, primarily surface areas without sufficient structure to evaluate the stereo images and polar regions due to lighting issues. The ASTER GDEM data is mostly free of voids in the sense that there are no frequent nodata pixels as in SRTM. This is achieved by using alternative data sources in those parts were the ASTER data is insufficient. This can be seen in the sample images below which show a part of the Rwenzori Mountains near 0.4° north, 29.8° east.

|
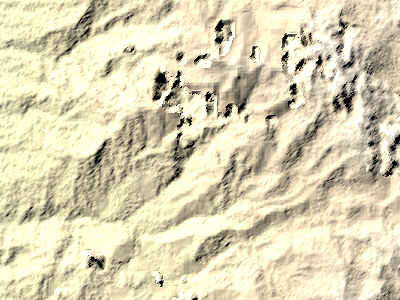
|
| SRTM DEM showing significant voids | ASTER GDEM with visible SRTM replacements and artefacts |
As you can see some parts in the GDEM data are lower resolution and less noisy - these are in fact SRTM data which has been used instead of the native ASTER data in those parts. This approach leads to two problems:
- The algorithm used to determine the reliability of the ASTER data and decide on replacement with alternative sources apparently is not always able to detect abnormalities in the data.
- When there is no alternative data available (in this example the SRTM voids) the ASTER data seems to be often used despite being unreliable.
Both problems lead to significant errors in the data of sometimes several hundred, occasionally even thousand meters. This can be better seen in the color coded image below on the right than in the shaded display.
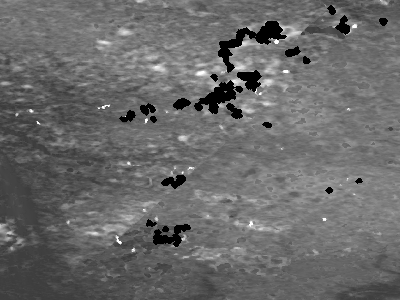
In addition to the elevation data file ASTER GDEM comes with a QA data set which can be used to estimate the reliability of the data and it also specifies the alternative data sources used. This data is shown below on the left. The black parts are where SRTM data is used instead of native ASTER data. The color otherwise represents the number of stereo pairs available for elevation determination between 1 (red) and 8 (blue). The decision to replace native ASTER data with alternative sources apparently does not solely depend on this number though and the artefacts with major elevation errors are not strictly limited to areas with only one or two stereo pairs although incidence of those artefacts is much lower in well covered regions.

|
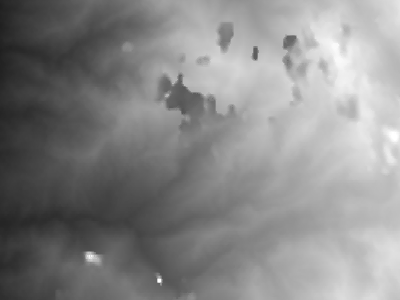
|
| ASTER GDEM QA data | ASTER GDEM |
For visualization purposes these artefacts are a major problem. Even if 99 percent of the data is of good quality significant errors even in a very tiny part of the surface can disturb a visualization a lot. In many cases including the sample region shown above the artefacts occur primarily in those parts where alternative data sources were not available. It is unfortunate that the QA file does not indicate those parts that would have been replaced with alternative sources had they been available. This information could be used to either replace the erroneous data with interpolated data from around (which is less disturbing in visualizations) or with alternative sources which have not been available to the GDEM producers.
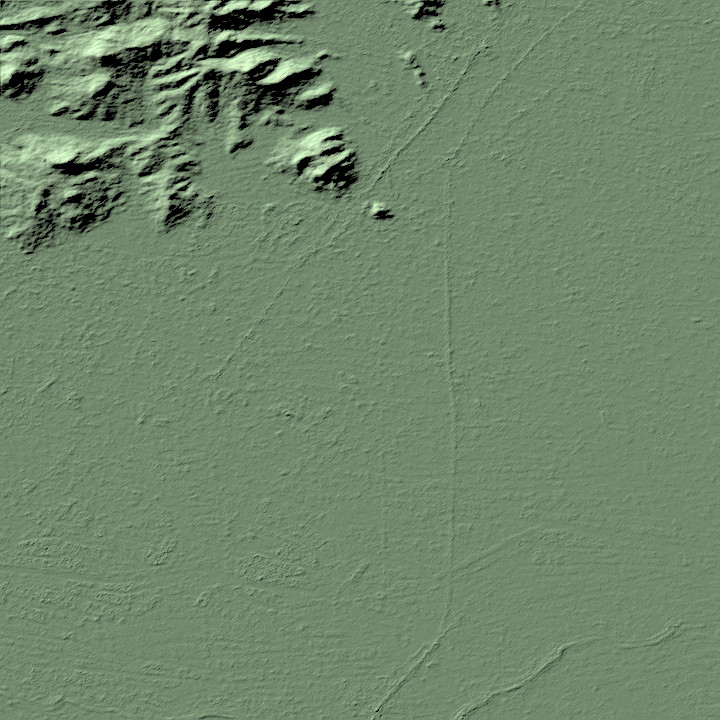
There is another type of large scale artefacts that occurs in form of steps in direction of the satellite path. These occur most in regions with poor coverage at the edges of the satellite images and are best visible in flat regions like the following example around 68.5° north, 61.5° east. Traces of such artefact are also visible in the Bodele depression sample above.

|
|
| ASTER GDEM step artefact (from lower left to upper right) | |
Here you can also see that there are also true voids in the GDEM data where no elevation could be determined and no alternative sources are available.
Summary
The ASTER GDEM data is a very interesting and useful addition to the existing SRTM data set. It can be well used to fill the voids in the SRTM data. Due to the artefacts and errors in the data however it is not well suited to be used directly in visualizations in most parts of the earth surface. To use it for this purpose, for example in the higher latitude regions, significant processing would be required first to remove the errors. Although the nominal resolution is much higher than of the publicly available SRTM version the noise in the data reduces this resolution advantage quite a bit.
Christoph Hormann, September 2012
Bibliography
The following reports contain a more detailed evaluation of the ASTER GDEM and SRTM data sets. They focus more on quantitative accuracy and less on the specific nature of artefacts and errors.
Visitor comments:
By submitting your comment you agree to the privacy policy and agree to the information you provide (except for the email address) to be published on this website.