

August 2015 update on the OpenStreetMap coastline data quality
This is part of a semi-regular collection of reports on the development of the OpenStreetMap coastline data starting with an initial analysis of the quality of the OpenStreetMap coastline data and continuing with updates 1, 2 and 3 and now here with the most recent update on the last year.
Recent changes in the OpenStreetMap coastline
This report covers a whole year since i skipped the spring update this time. As usual there have been a lot of small changes and improvements and i will only cover the larger and more unusual ones.
- Detailed mapping of several areas in
 southern Chile and Tierra del Fuego - there is still a lot of bad PGS data left here which is also full of gaps and errors due to clouds and shadows.
 - Fairly extensive improvements at the coast of Norway, mostly import based. Like in Chile there is still a lot of work left.
- Improvements on the Azores, including the westmost point of Europe.
- Some improvements of formerly very crude coastlines in Svalbard.
- New mapping of eastern Devon Island where there were previously huge errors.
- A lot of mapping in Fiji,
Vanuatu and
Tonga.
- Updates to the largest Antarctic ice shelves - which account for by far the largest actual change of the shape of the global coastline as mapped in OSM.
- The Suez Canal has now been tagged as coastline which splits Africa and Eurasia into two separate Polygons. While the Suez Canal has no locks and could therefore indeed be considered part of the ocean domain it is also an artificial canal. If this tagging is correct therefore depends on the exact interpretation of the meaning of the coastline tag.
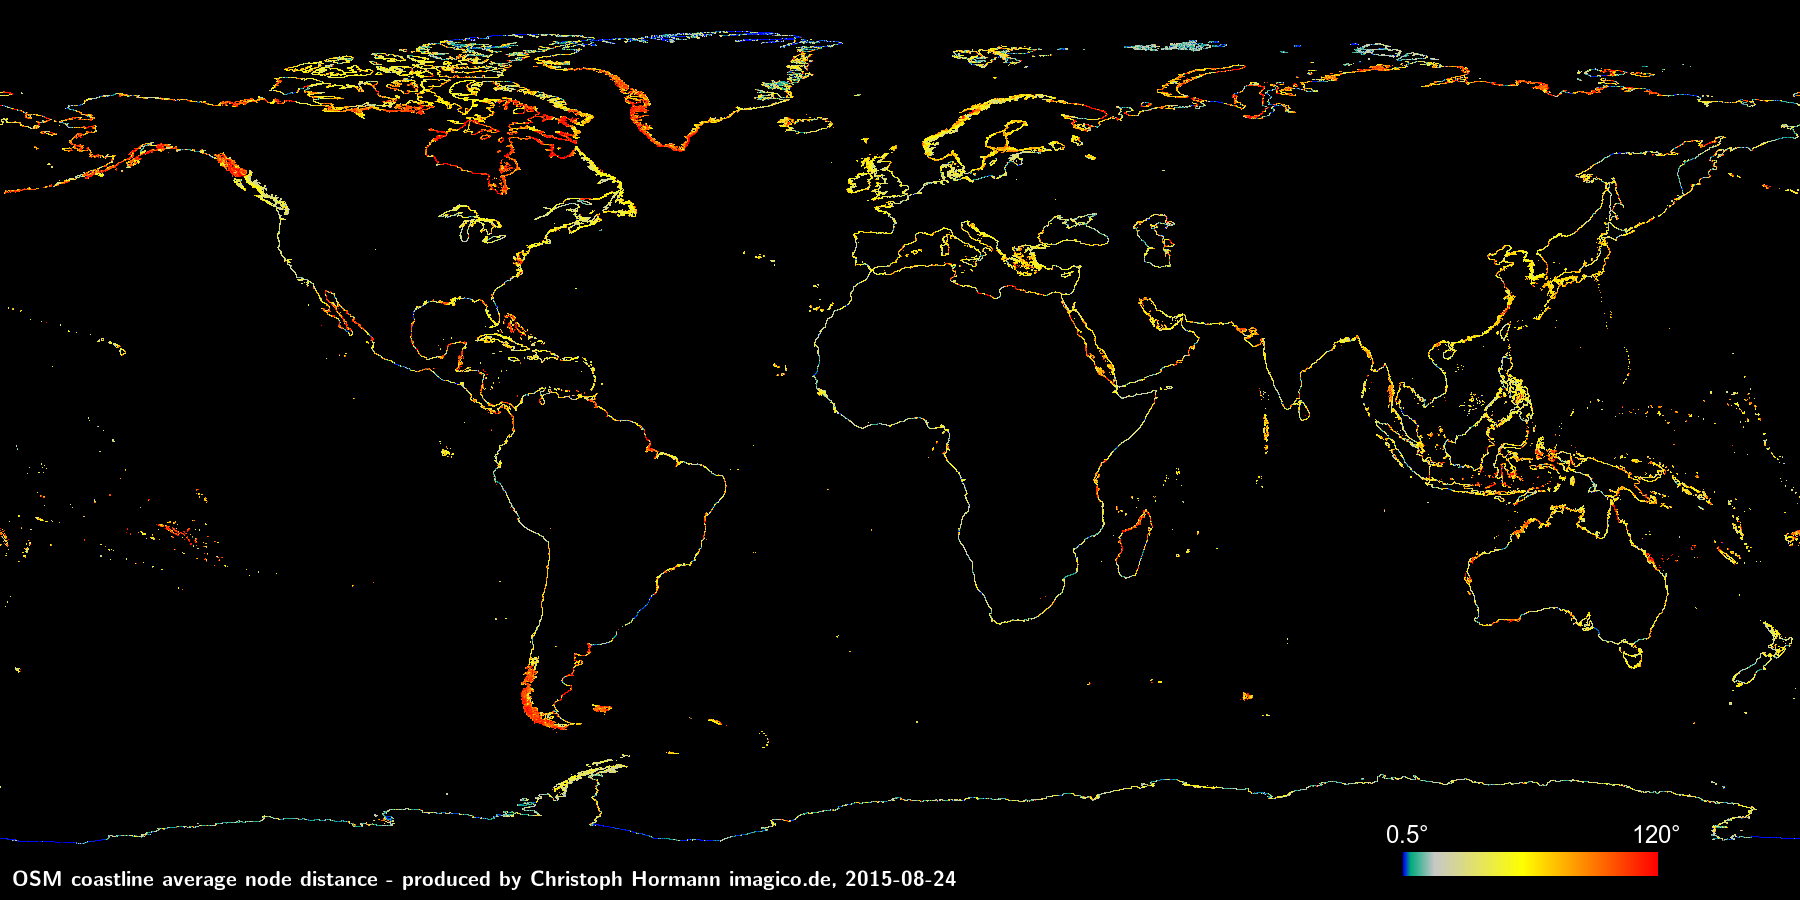
The total length of the coastline is now 1.953 million kilometers (again somewhat less than last time). The average node distance is now 59 meters (was 60 last year).
The mapping of lakes as coastlines
There have also been changes in the mapping of lakes as coastline. In general this is a remainder from times when large polygons could not be well represented in the OSM database otherwise. There are a number of large lakes still mapped as coastline, it is generally accepted that these may stay this way until the local community decides otherwise but it is also generally accepted that no lakes must be newly mapped with the coastline tag.
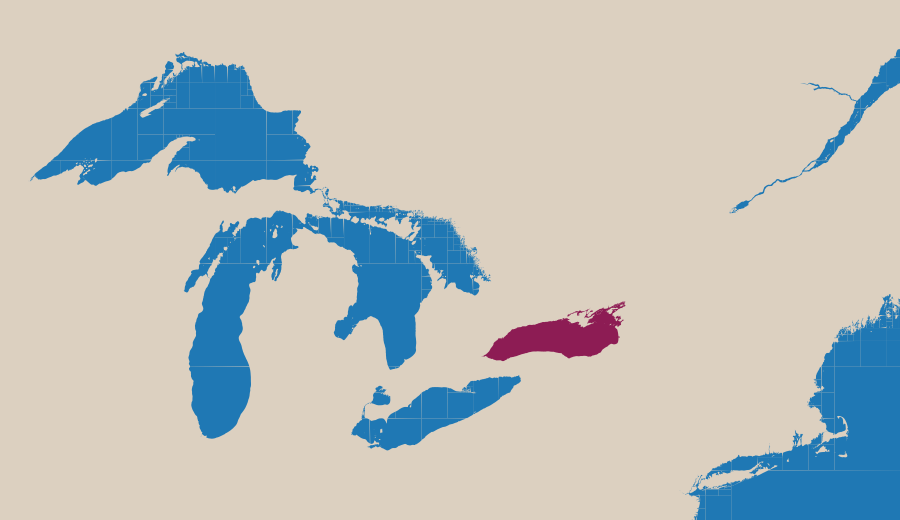
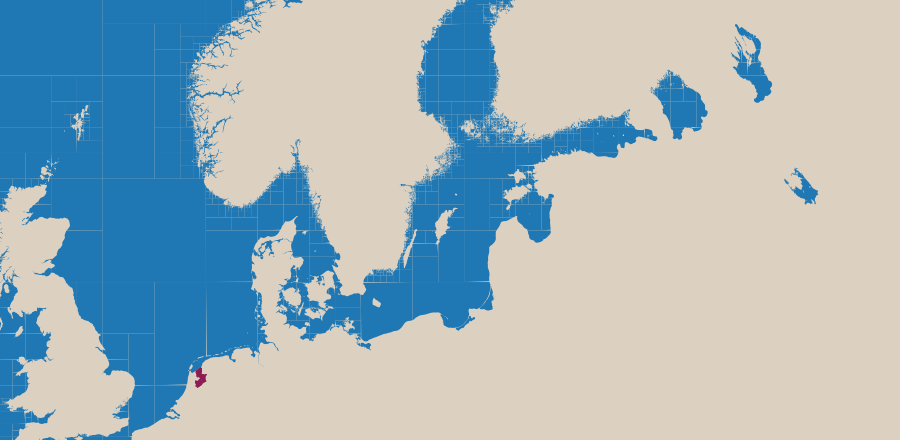
There are two large lakes where the coastline tag has been removed last year, that are Lake Ontario and the Canada/US border and the IJsselmeer in the Netherlands. At the same time the Rybinsk Reservoir in Russia has been newly tagged as such.
This is somewhat questionable since it not only breaks with the convention of not newly tagging lakes as coastline, it is also by far not one of the largest lakes - not worldwide, but also not in Russia.
Globally there are now the following lakes left that are tagged with the coastline tag, listed in descending order of size:
- Caspian Sea
- Lake Michigan-Huron
- Lake Superior
- Lake Erie
- Lake Ladoga
- Lake Onega
- Nettilling Lake
- Rybinsk Reservoir
All of them are also mapped as multipolygons meanwhile, only for two of them, Lake Michigan-Huron (where there are separate multipolygons for Lake Michigan and Lake Huron) and Lake Superior the multipolygons are so complex they cause serious trouble for data users. The Caspian Sea - while by far the largest - is not mapped in that much detail so the multipolygon is fairly manageable. The first three in the list also represent the largest lakes globally, the others are all significantly smaller than the largest other lakes on earth that are not mapped as coastline. So for the purpose of consistency it would be a good idea to try shortening the list above in the future - Lake Ontario and IJsselmeer have already set a good example.
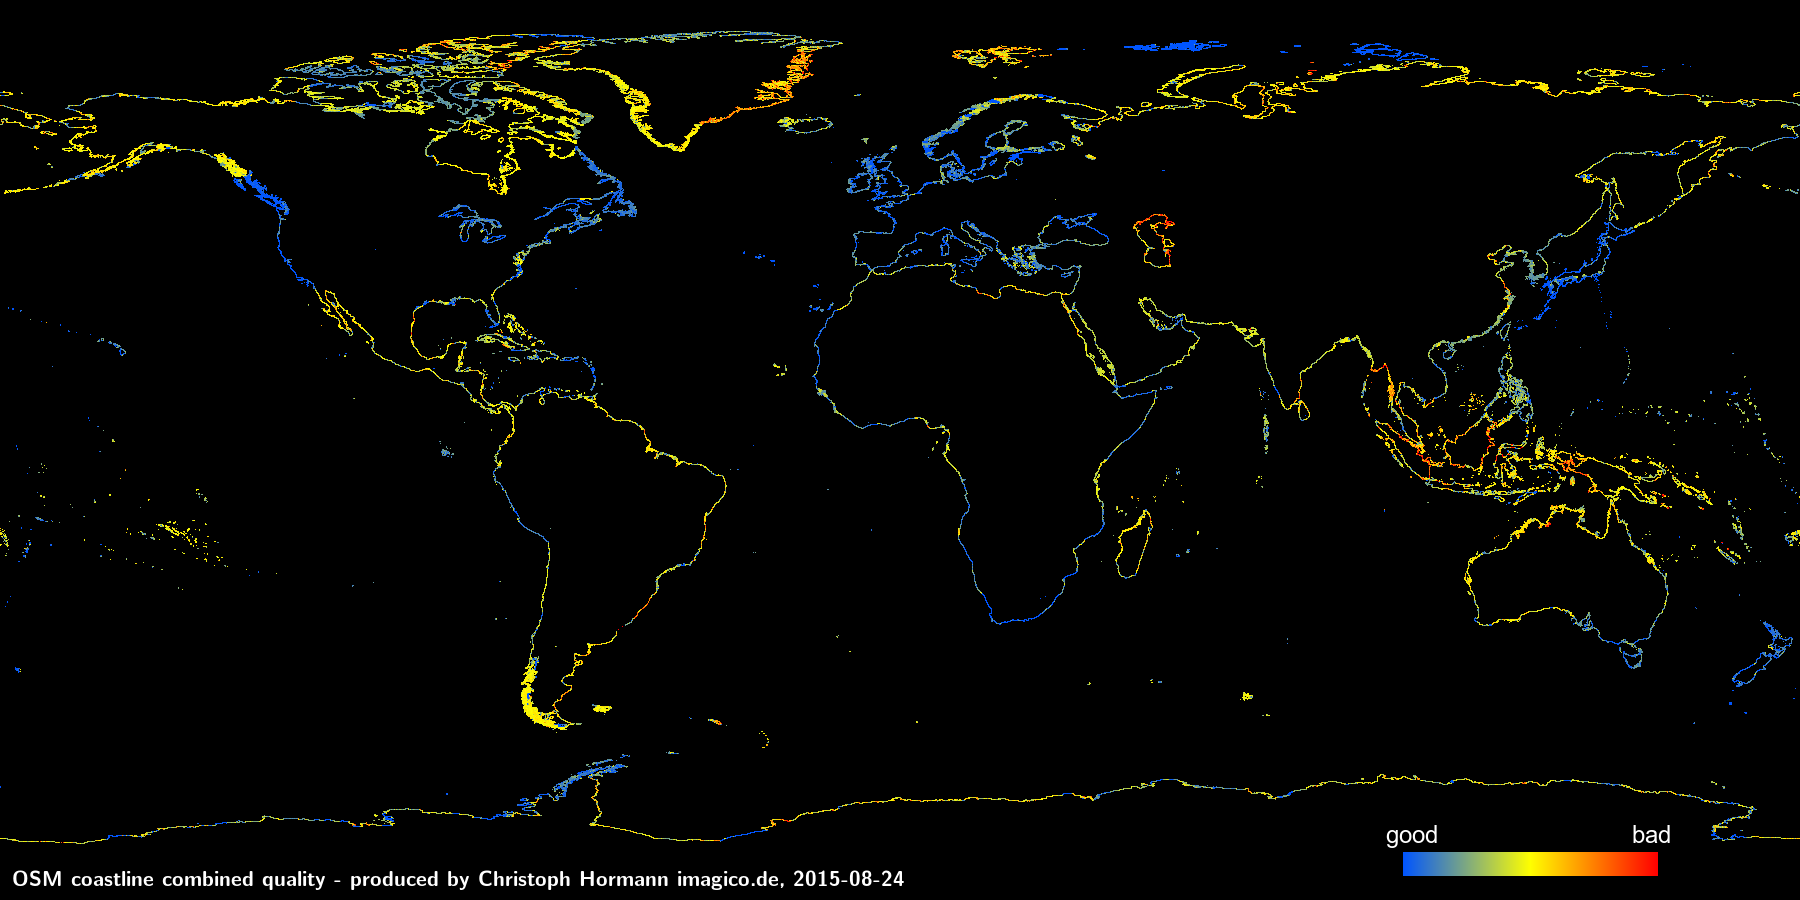
Updated quality analysis maps
Below are new version of the node distance, derivation angle and combined coastline quality maps. For detailed explanation see the initial coastline quality analysis.
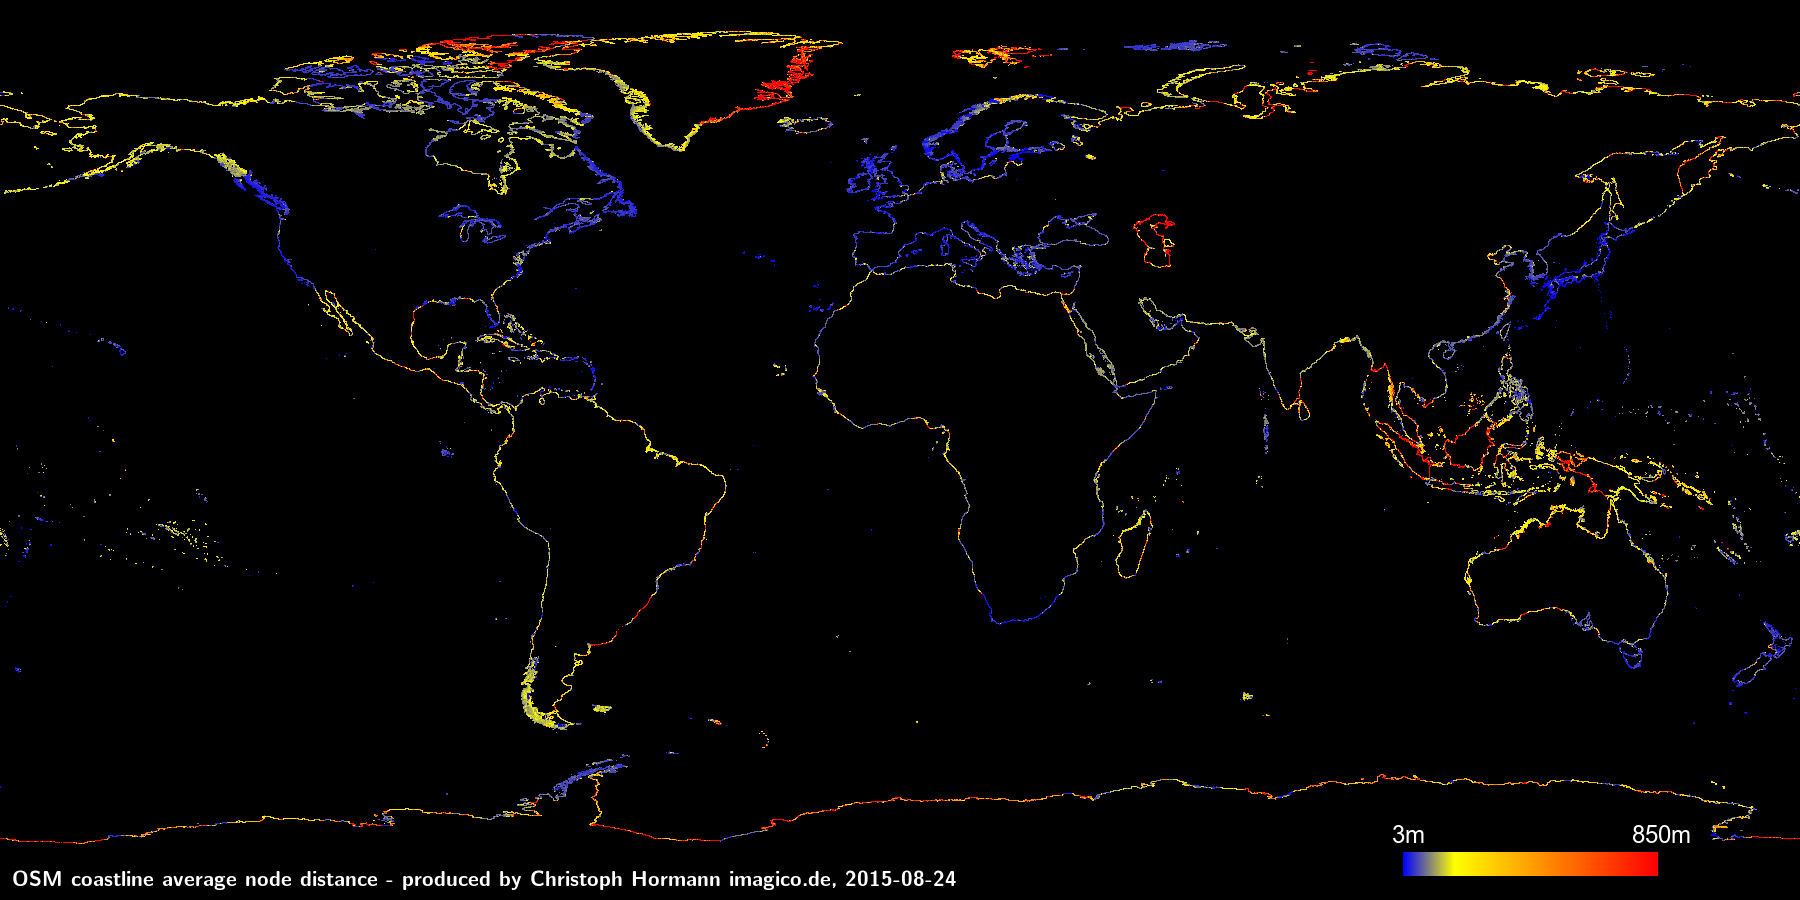
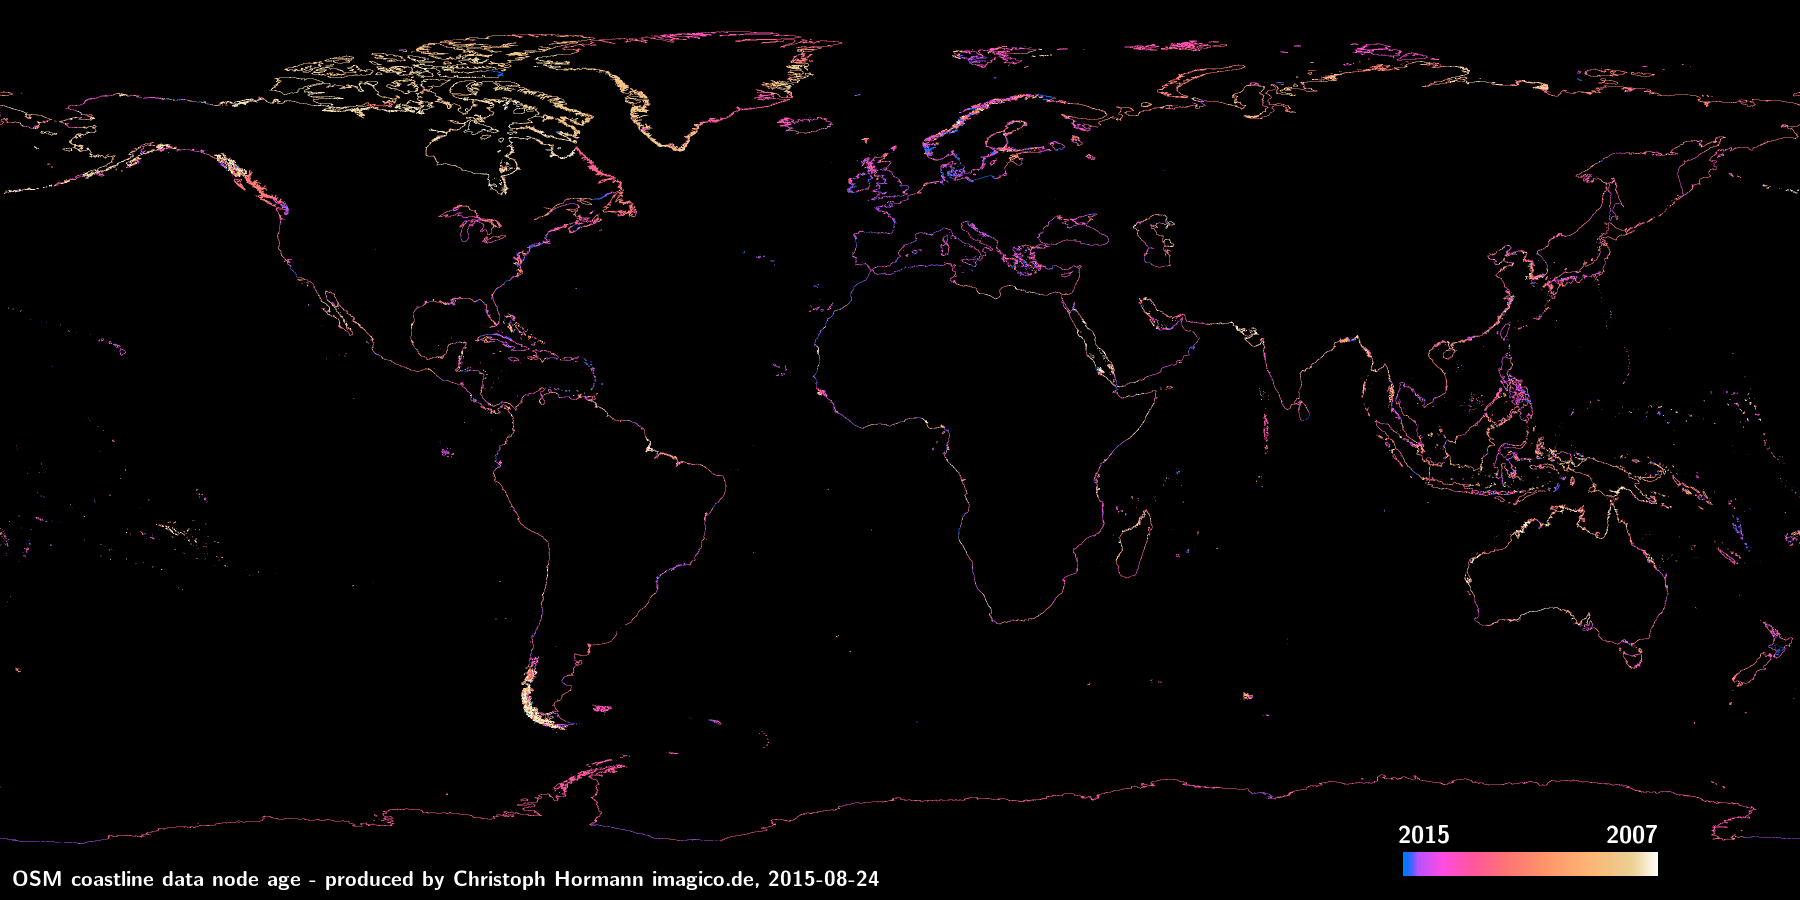
The map of the coastline data age is slightly changed from the previous reports, it now uses continuously changing color depending on exact age.
Christoph Hormann, August 2015

Visitor comments:
no comments yet.
By submitting your comment you agree to the privacy policy and agree to the information you provide (except for the email address) to be published on this website.