

Assessing the OpenStreetMap coastline data quality
One aspect of OpenStreetMap data everyone using it should know and everyone using it on a larger scale will sooner or later realize is that data quality varies strongly. The coastline data i have been working quite a lot with recently is somewhat special in this regard since it is the only type of data on OpenStreetMap that is routinely processed as a whole by the OpenStreetMap project itself and as a result there is some ensurance of consistency in the data (which is an ongoing struggle however – see Jochen Topf's recent status report). This does not say anything about the accuracy of the data which i will try to assess here.
I have written previously that the OpenStreetMap coastline data has reached a fairly good overall level of quality – a claim i have not backed up with any verifiable information though. The major difficulty of evaluating the accuracy of any geographic data set is that you would need much better data of the same features as reference for an accurate assessment. Specifically if you have a coastline data set you would need to know the shape of the actual coastline significantly more precisely that the data you wish to evaluate to actually say something about its accuracy.
Now while there are certainly local data sets with coastline information more detailed than OpenStreetMap data most of them are not so much more detailed that differences between these data sets and OpenStreetMap data could comfortably be attributed exclusively to inaccuracies in the latter. All global data sets (some conveniently listed on the Openstreetmap wiki) are at least in parts less detailed than OpenStreetMap data so they cannot be used as a reference either.
How to assess data quality without a reference
So in the end we have to think about how to evaluate the data without a reference. The first idea that comes to mind is to measure the density of data points. The coastline data is represented as line strings – a set of points on the earth surface connected by straight lines (what exactly straight means here will be left to discuss another day). The denser the data points the better the actual coastline can be represented. But there are two problems with this approach: First a smooth coastline can be fairly accurately represented by very few nodes with a lot of distance between them. Second – if the nodes are not at the actual coastline a very detailed coastline representation in the data can still be inaccurate.
|
|
|
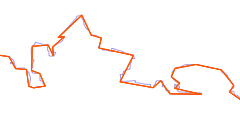
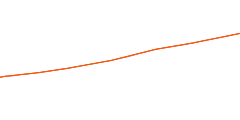
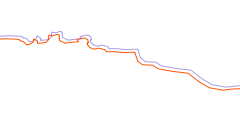
| rough coastline with low detail approximation | smooth coastline with low detail approximation | coastline with detailed but inaccurate approximation |
The latter possibility is something that cannot be solved without accurate reference data. In the simplest case of a constant offset as shown in the above illustration the data might look exactly like the reference except for the offset and still be inaccurate. We can however do something about the former. The major difference in the form of the red lines in the first and second image above is the angle between the line segments at the nodes. Calculating that gives us a second measure to characterize the data in addition to the node distance.
Before i now analyze the coastline data i would like to take a step back and see what we are actually looking at here. This requires understanding how the data is actually acquired. In case of OpenStreetMap this varies somewhat depending on the data sources but data is nearly always based on aerial or satellite images and processing essentially can be characterized by the following drawings:

|

|
| coastline data acquisition based on image classification | coastline data acquisition by manual tracing of images |
Most other coastline data sets as well as a large part of the Openstreetmap data which has been imported from other sources (most notably PGS) have been produced from satellite images by land/water classification and subsequent vectorization of the classification mask. Those parts of the OSM coastline produced by community mapping on the other hand are manually traced on aerial or satellite images by the mappers.
Now as i said the lack of a reference to compare the data to restricts our ability to look at this. Since we only have the final data to analyze we can essentially only look at the steps in between through the filter of the processing steps coming afterwards. As a result we have a clear view at the vectorization/tracing step producing the line string data we analyze. But saying something about the quality of the data requires a deeper look into the process which we will only be able to do indirectly and only by making assumptions about the vectorization/tracing step.
Data analysis
I will start with an analysis of the average distance between coastline points across the earth surface. The color of each pixel in the following image represents the average node distance of the coastlines within the area of this pixel.
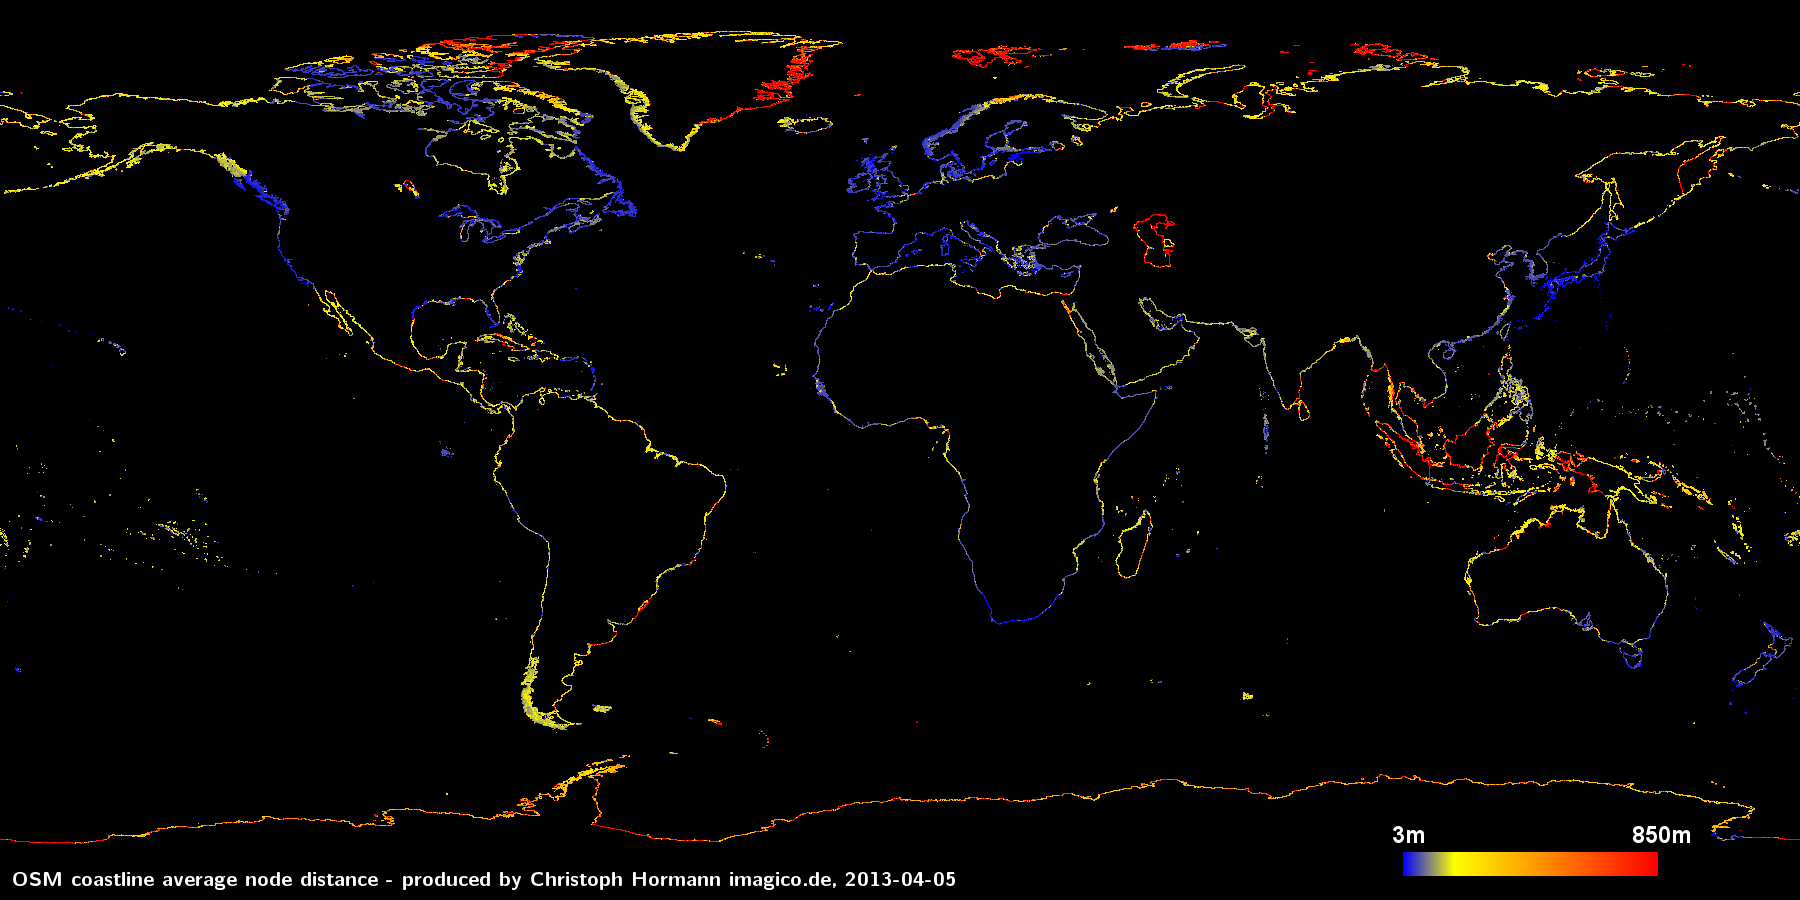
You can click on the image to view a larger version. It can be seen that the average point distance varies quite significantly and this variation is to a large extend neither random nor can be clearly attributed to differences in the smoothness of the actual coastline. Note the upper limit for the color scale of 850m has no particular significance. There are some (smaller) parts where the average distance is even larger.
It can be clearly seen that those parts of the earth otherwise densely mapped, in particular Europe and Japan feature a high coastline node density – as to be expected. What's more interesting are abrupt changes in node density, like at the North American west coast at the border between Canada and Alaska or in Greenland the difference between east and west coast.
Next i have a similar image of the average derivation angle at the coastline nodes. Zero degrees means a node is right in the middle between the previous and the next node in the line and 90 degrees means the line is making a right angle turn to either side at this node.
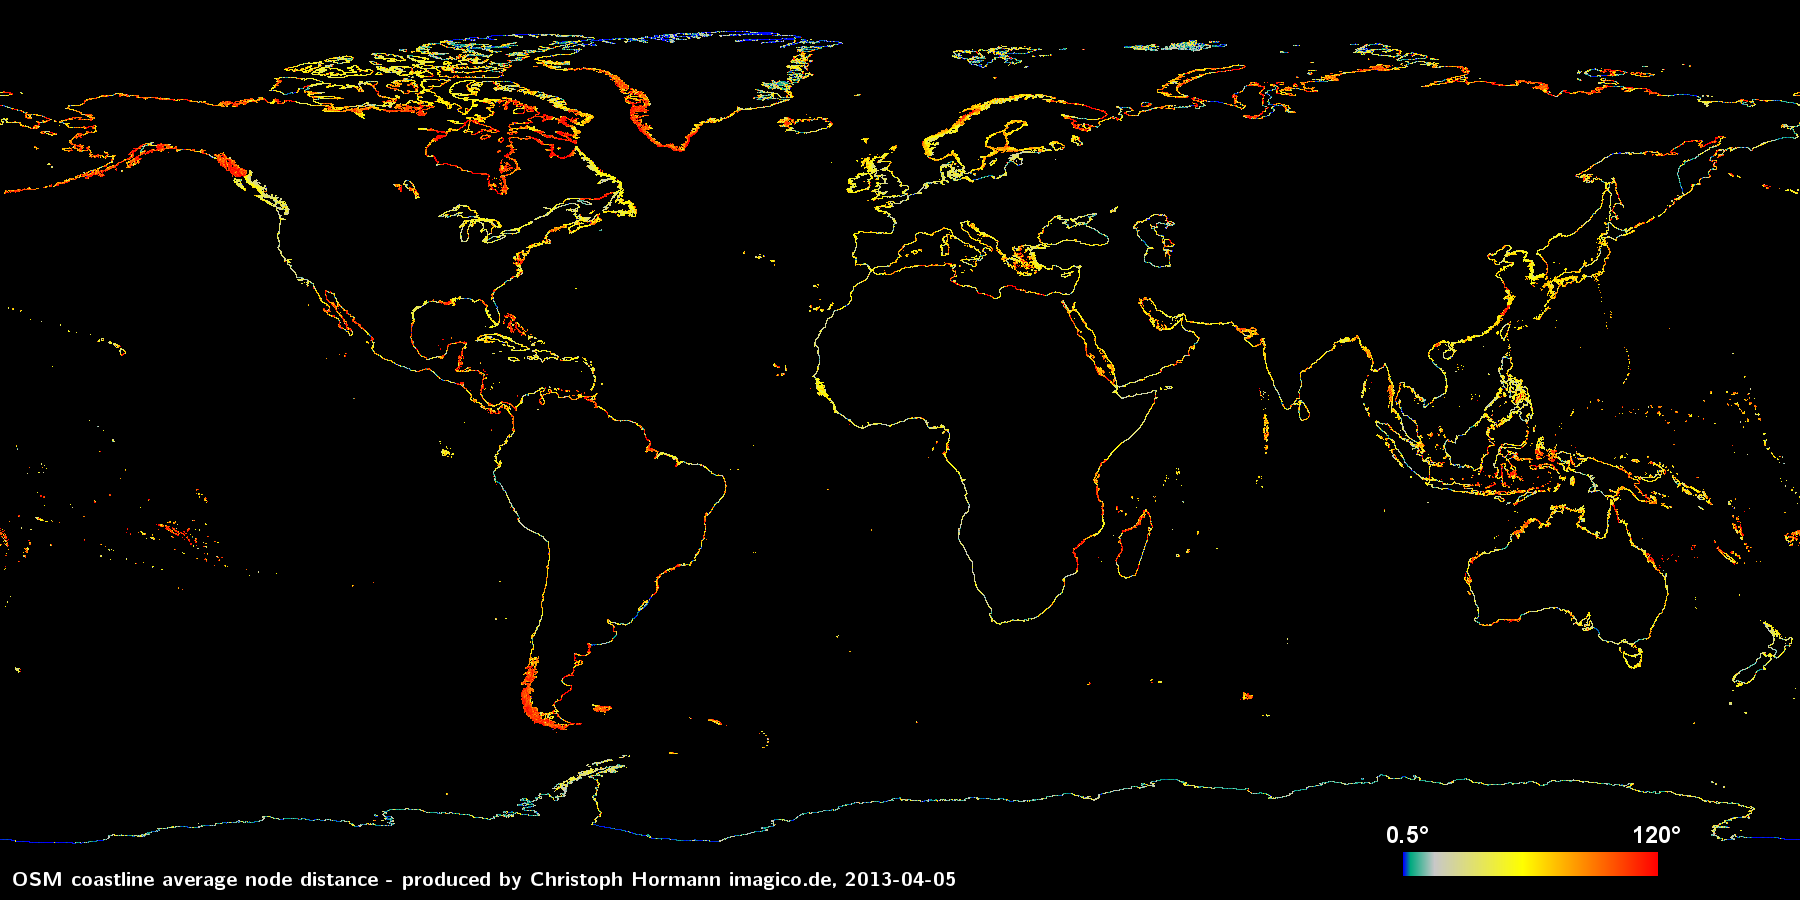
First of all remarkable is that the average derivation angle is quite high (global average is 63 degrees). On the scale we are looking at here (between a few and a few hundred meters) clearly defined sharp corners are not particularly common on the earth coastline. So a large average angle indicates the coastline data is not a particularly good representation of the imagery it is derived from or in other words: by using more detailed vectorization or manual tracing (see the diagrams above) a significantly more accurate coastline could probably have been produced from the same image data. Why has this not been done? The reason is probably austerity with respect to data sizes. Often during data production the goal is not maximum accuracy but complying with data volume constraints.
Most of the areas with universally high average angle (the red/orange parts in the above map) are regions where data has been imported from PGS. This data has a quite unique signature both in respect to average point distance and average derivation angle. This can be observed most clearly in southern Alaska, southern Chile and western Greenland. This signature is probably a result of the vectorization technique used to produce this data but note not all coastline data produced with automated techniques will be similarly uniform. In fact efficient vectorization techniques will vary the node density depending on the smoothness of the line. This can be seen at the coast of western Poland for example (although here is is probably manually mapped) where the average node distance is high (among the highest in central Europe) while the average angle is low. The actual coastline is very smooth here so only few nodes are required for an accurate representation and they still show a low derivation angle.
Since there are very few actual corners in the real coastline at the scale we talk about here it can be reasonably said that there is an optimum derivation angle of about 10-20 degrees. How close the data is to this optimum does not say anything about the accuracy of the data but about how well the line strings represent the underlying data source. If the angle is much larger like in case of the PGS data information that is in the source data is lost in the too coarse vector representation. If the angle is much lower the data is actually more detailed than necessary.
Using these observations we can now try to combine these two measurements – the average node distance and the average derivation angle – into a combined quality value:
log(dist_avg*max(10, angle_avg))
Put into words this formula means: a low distance between nodes results in a low value (=high quality of the data) even if the average angle is high. A low average angle equally results in a low combined value even if the node distance is high but angles lower than 10 degrees are not considered to improve quality. The logarithm is just for scaling. The resulting combined quality value is shown in the following image:
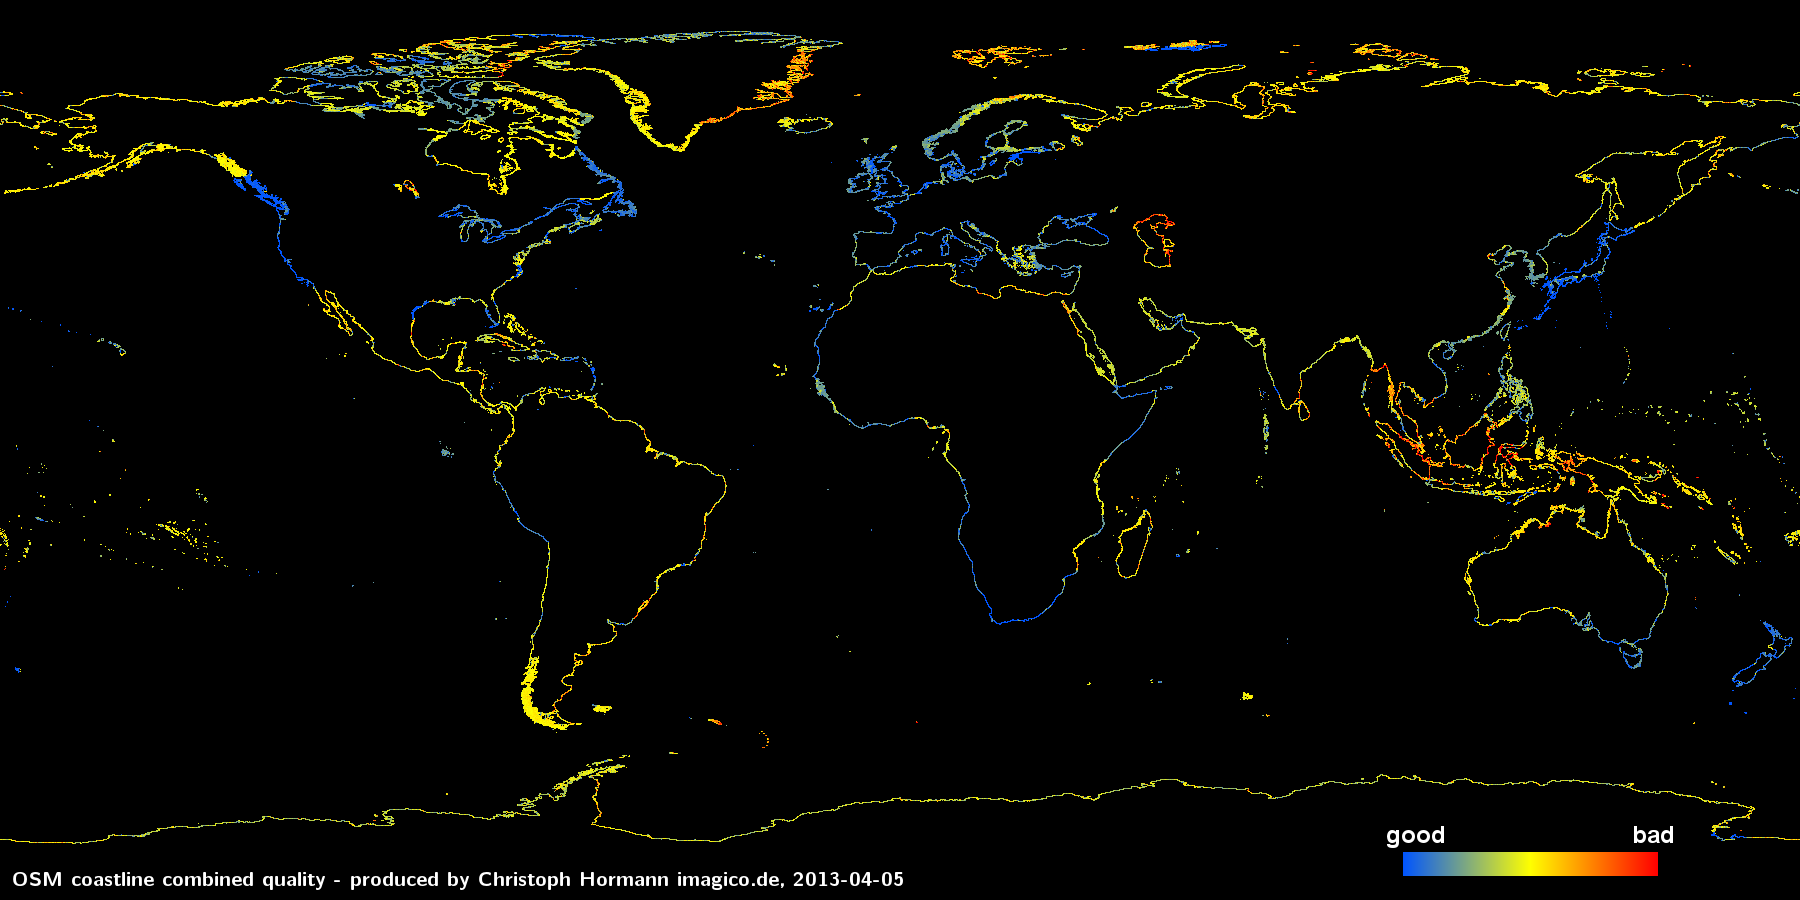
Note this measure of 'quality' is to be interpreted with care. While red areas are most likely areas with fairly low accuracy it does not really work the other way round: Not all blue sections are really good quality. This assessment particularly fails if there has been a significant amount of smoothing applied to the data.
This map indicates three larger areas where improvements in data quality are most seriously needed:
- Indonesia and surrounding (in particular Malaysia, Thailand and Burma)
- The Caspian Sea
- Eastern Greenland
There are various other smaller areas not very well represented, especially some of the arctic and subantarctic islands but the above are the largest areas.
It should be noted that at least Indonesia is much better represented in the PGS data – apparently this has never been imported there (or in an older version that was less accurate). However since there has been a lot of manual mapping in the region meanwhile large scale imports of coastline data will be difficult.
A few highlights and numbers
Finally i would like to point out a few highlights and examples from the data as well as some overall statistics:
I already mentioned the global average derivation angle (63 degrees) – the average distance between nodes is 66 meters resulting in a total coastline length of 1.99 million kilometers. The longest segment that is not artificially closing the coastline at the 180 degree line (those were not considered in the statistics here) is 23.7 kilometers long but this is not actually part of a coastline but runs across the mouth of a river (there are several cases of river mouths with the coastline ending very far towards the sea leading to long straight segments).
The regions that would be most important to improve have already been mentioned above. I will point out two specific examples of particularly bad data quality here:
While the former of these two is prominently visible in deep red in the last map above the latter is not - although whole fjords of more than 50 km length are missing there. This is because the data is smoothed significantly. I don't know the exact source but it could be from fairly old maps, possibly based on inaccurate/incomplete surveys of the region.
On the positive side of regions where the OSM coastline is particularly detailed i would like to point out Estonia where the coastline is not only very detailed but the average derivation angle is right in the optimal range described above. There are probably various urban harbor coastlines that have been mapped in even more detail down to sub meter accuracy but i am going to skip those in this global analysis.
Christoph Hormann, April 2013

Visitor comments:
By submitting your comment you agree to the privacy policy and agree to the information you provide (except for the email address) to be published on this website.