

Mapping rivers
When looking for geographic data these days ![]() Openstreetmap
is one of the most extensive sources with respect to data related to human activities, i. e. roads, buildings, railroads and similar
features. For natural features however, like relief, water bodies and land cover, Openstreetmap data is of much lower and fairly non-uniform quality (see my broader analysis of this situation). Some other sources offer better data but the lack of a uniform quality level is a common issue. Jonathan de Ferranti has been working on addressing this problem with respect to relief data for several years. Here you can find information on a technique to produce uniform quality data of the rivers and lakes by combining several types of remotely sensed data.
Openstreetmap
is one of the most extensive sources with respect to data related to human activities, i. e. roads, buildings, railroads and similar
features. For natural features however, like relief, water bodies and land cover, Openstreetmap data is of much lower and fairly non-uniform quality (see my broader analysis of this situation). Some other sources offer better data but the lack of a uniform quality level is a common issue. Jonathan de Ferranti has been working on addressing this problem with respect to relief data for several years. Here you can find information on a technique to produce uniform quality data of the rivers and lakes by combining several types of remotely sensed data.
Update (08 Nov. 2012): I updated the sample data, version 2 uses some more landsat scenes and thereby fixes a few issues. It also makes use of the existing Openstreetmap data and fixes an error in the ice mask processing. More details can be found below.
Water body data is important for just about any kind of map since water is both a mean of transport as well as an obstacle to human activities and in most parts of earth it is the most important factor that forms the natural landscape. At the same time it is remarkable that nearly all of the water body data that exists today has been manually produced either by mapping the water body in the field or by manual analysis of aerial or satellite imagery.
As a result of this available water body data is of strongly varying quality and inconsistent form. In regions of high interest like central Europe fairly accurate data exists but is often subject to unclear or restrictive licensing. Since water courses are subject to change, both naturally as well as though human activities, knowledge of the time the data was acquired would be important as well – but is rarely available.
The only freely available global data sets of water bodies i know of are the ![]() VMAP0 hydro layers and
VMAP0 hydro layers and ![]() Openstreetmap. Due to the manual production techniques both have their issues. VMAP0 – being generated from fairly old low resolution maps offers fairly low detail although the level of detail is globally quite uniform. There are however differences in accuracy between different parts of the world with serious systematic errors in some part both in the placement of rivers as well as in delineation of the different river systems.
Openstreetmap. Due to the manual production techniques both have their issues. VMAP0 – being generated from fairly old low resolution maps offers fairly low detail although the level of detail is globally quite uniform. There are however differences in accuracy between different parts of the world with serious systematic errors in some part both in the placement of rivers as well as in delineation of the different river systems.
Data in Openstreetmap on the other hand is fairly accurate and high resolution but often incomplete in the way that only selected major rivers are present. In most parts of the world water body data seems to be manually digitized from aerial or satellite photos although this is rarely documented in the metadata.
Automatic river mapping
The reason why water body map data is almost exclusively produced manually is due to the fact that water bodies, especially rivers, are not well visible to remote sensing techniques. Even a river of more than ten meters in width can be completely covered by trees for example. There are fairly reliable techniques to classify visible water surfaces in satellite images but there are commonly only used at a very small scale and fail in cases where the water is not visible from above.
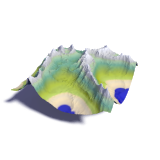
The approach i took here is to combine elevation data and satellite imagery to determine the river courses. The elevation data (in this case primarily ![]() SRTM) allows to determine the potential courses of water in the terrain although it does now allow to tell if a river actually exists there or not. In addition this step fails in flat areas where the inaccuracies and noise of the elevation data are too high in comparison to the actual altitude differences. By analyzing satellite images (in this case
SRTM) allows to determine the potential courses of water in the terrain although it does now allow to tell if a river actually exists there or not. In addition this step fails in flat areas where the inaccuracies and noise of the elevation data are too high in comparison to the actual altitude differences. By analyzing satellite images (in this case ![]() Landsat data) the areas covered with water are detected based on their spectral properties. This of course is not very reliable even if several different satellite images are combined to detect and eliminate major errors. But by combining the results of image classification with the potential river network calculated from the elevation data it is possible to produce much more reliable data than with one of the data sources alone.
Landsat data) the areas covered with water are detected based on their spectral properties. This of course is not very reliable even if several different satellite images are combined to detect and eliminate major errors. But by combining the results of image classification with the potential river network calculated from the elevation data it is possible to produce much more reliable data than with one of the data sources alone.
I will not get into details here on this technique at the moment. It consists of quite a lot of steps and numerous problems that can arise from various errors in the data sets need to be considered. The most important aspect is that there is no hand work involved except for adjusting some parameters for the initial classification of the Landsat images. I thought about automatizing this as well but since selection of the Landsat scenes has to be done manually it makes a lot of sense to set this parameters while doing the necessary quality check on the scenes.
The examples below are from a test run on a 4x6 degree region (90–96° east, 28–32° north). This region was chosen to contain a number of terrain types challenging for this approach. Over 100 Landsat scenes were used to ensure at least triple coverage of all parts.
|
|
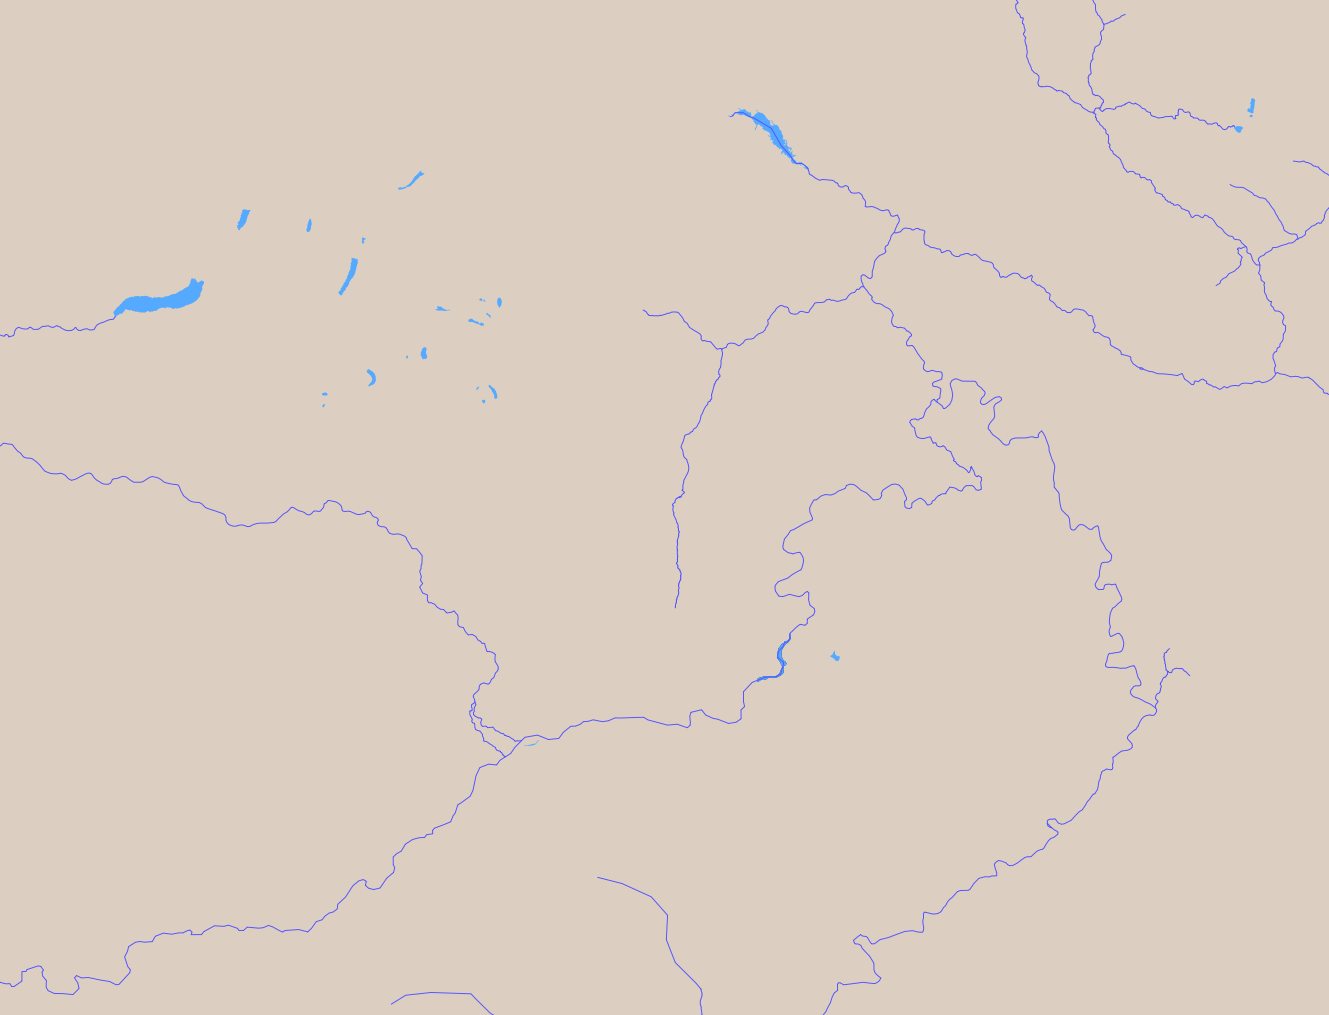
| Openstreetmap data of the first sample area (approx. 190km from left to right) | VMAP0 data of the first sample area |
|
|
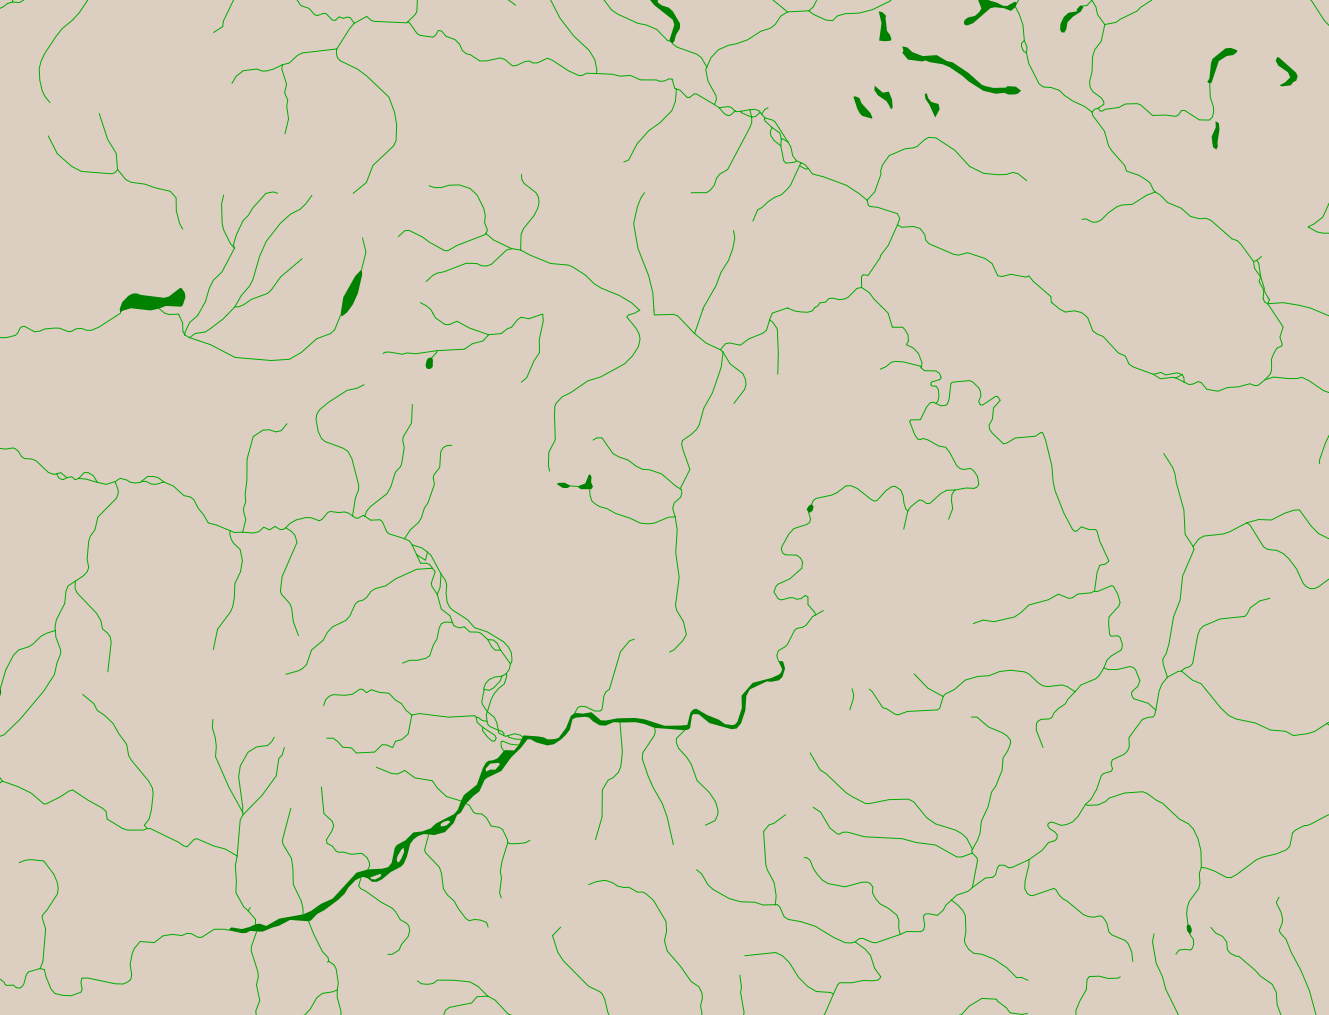
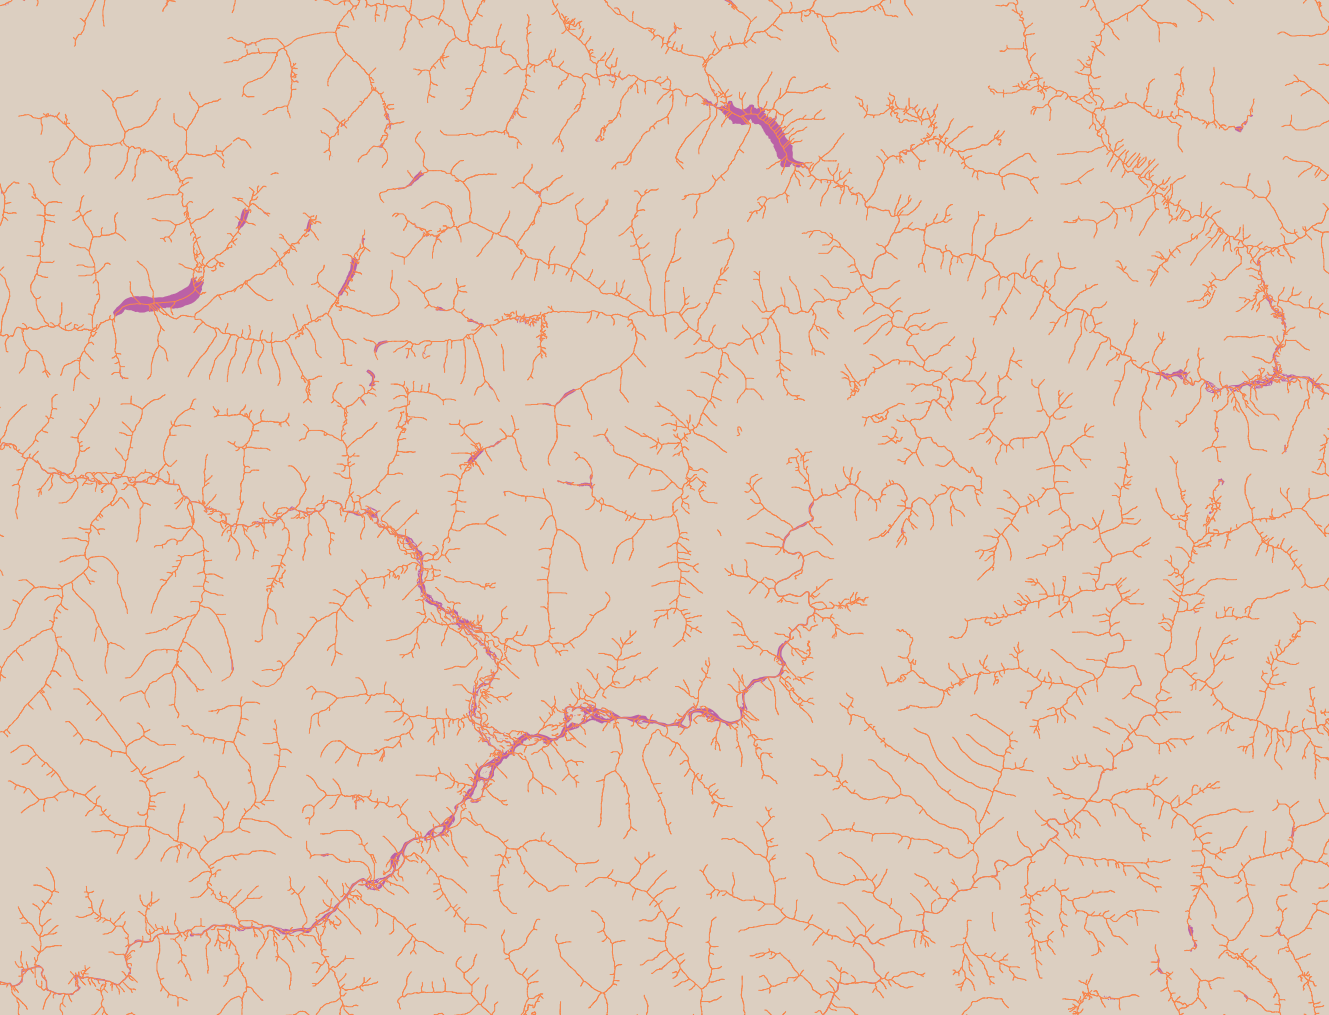
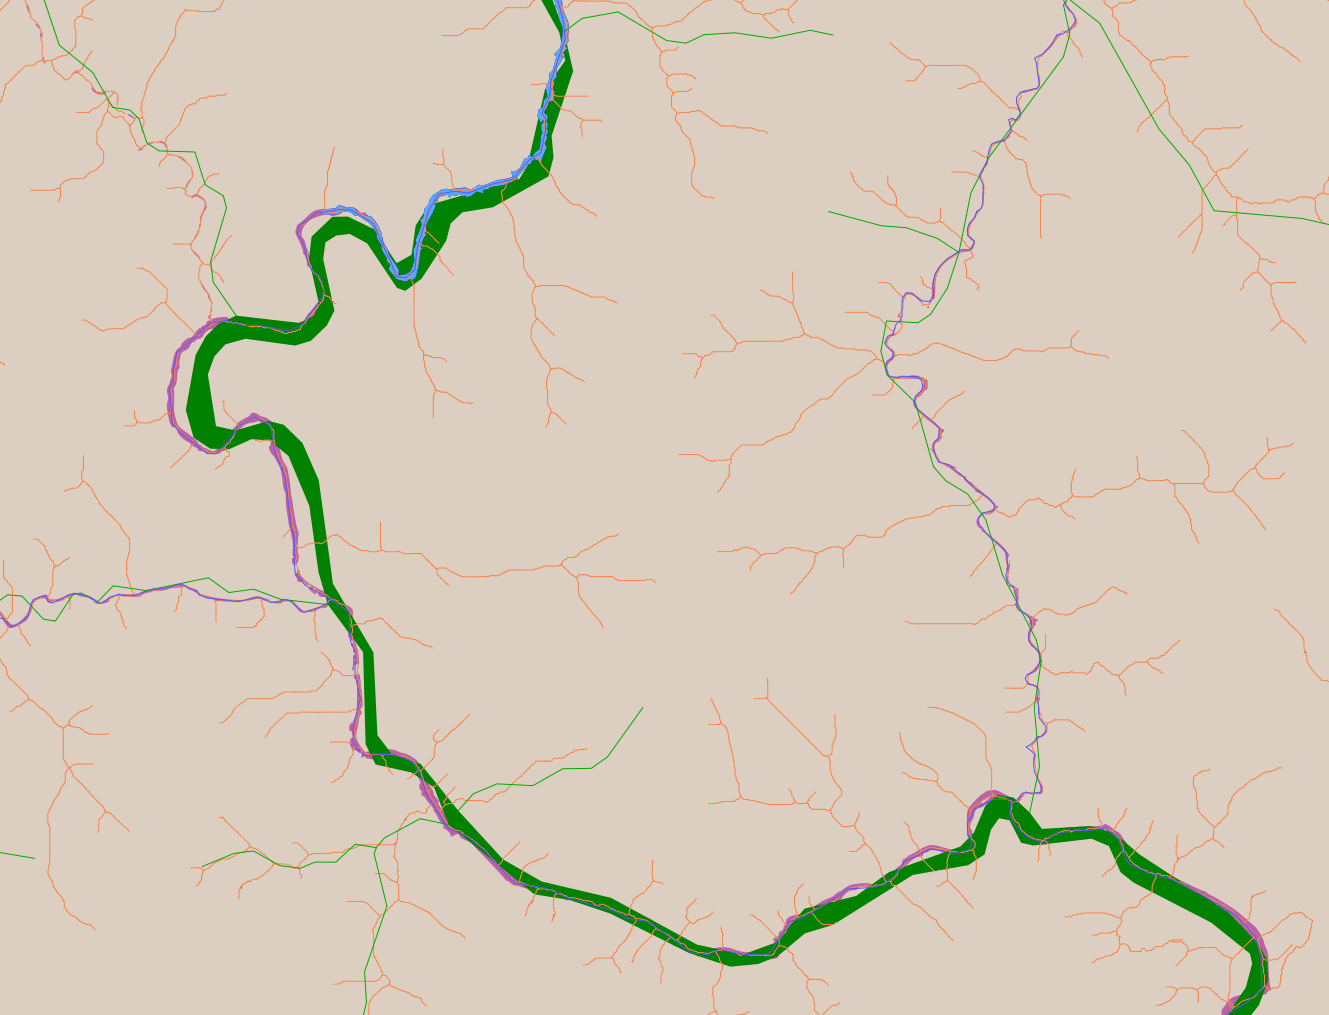
| Data produced using the technique described here | All three datasets together for comparison |
The Openstreetmap and VMAP0 reference images above show what has been described before: The VMAP0 is less detailed than the Openstreetmap data but contains a lot more smaller rivers. The data set produced using the technique introduced here is comparable in detail with the OSM data but contains smaller rivers than even the VMAP0. For a lot of applications the smallest of those (some just a few km in length) are not of interest but the data set can be easily thinned out for those purposes. When comparing the three data sets in the last image you can also see the OSM data and the data from here line up fairly well while the VMAP0 data in some parts shows a large offset of up to several kilometers.
There are various smaller obvious errors visible even in this small area and you can find a lot more in the full data set including various larger ones. While some of these errors could probably be avoided by improving the processing technique it will not be possible to produce a 100 percent error free data set since there are always errors in the source data.
|
|
| Openstreetmap data of the second sample area (approx. 95km from left to right) | VMAP0 data of the second sample area |
|
|
| Data produced using the technique described here (second sample area) | Third sample area, all three datasets together for comparison (approx. 42km from left to right) |
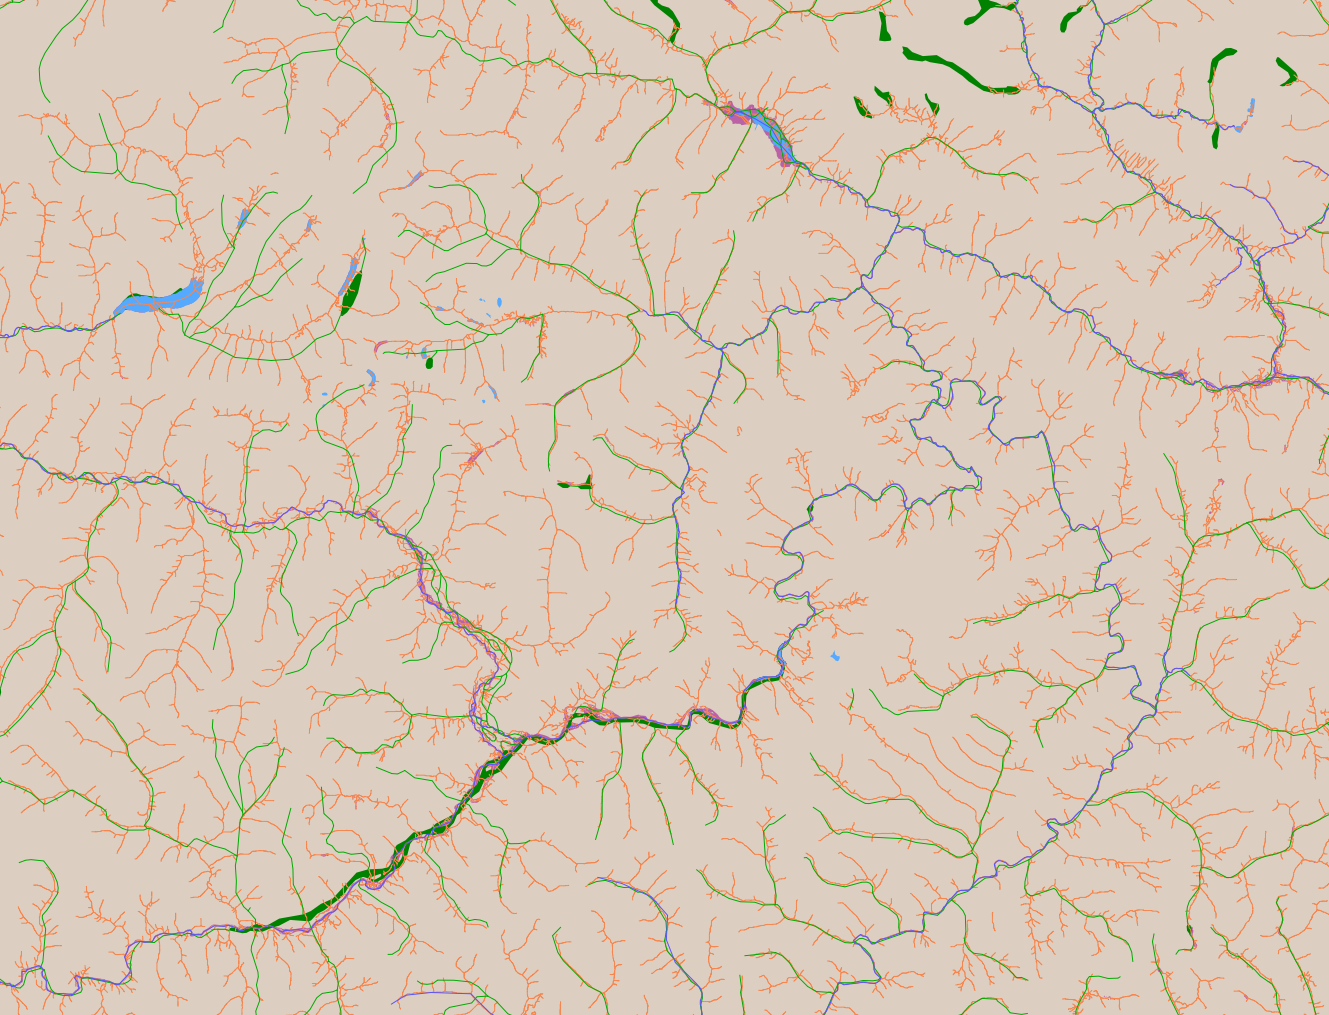
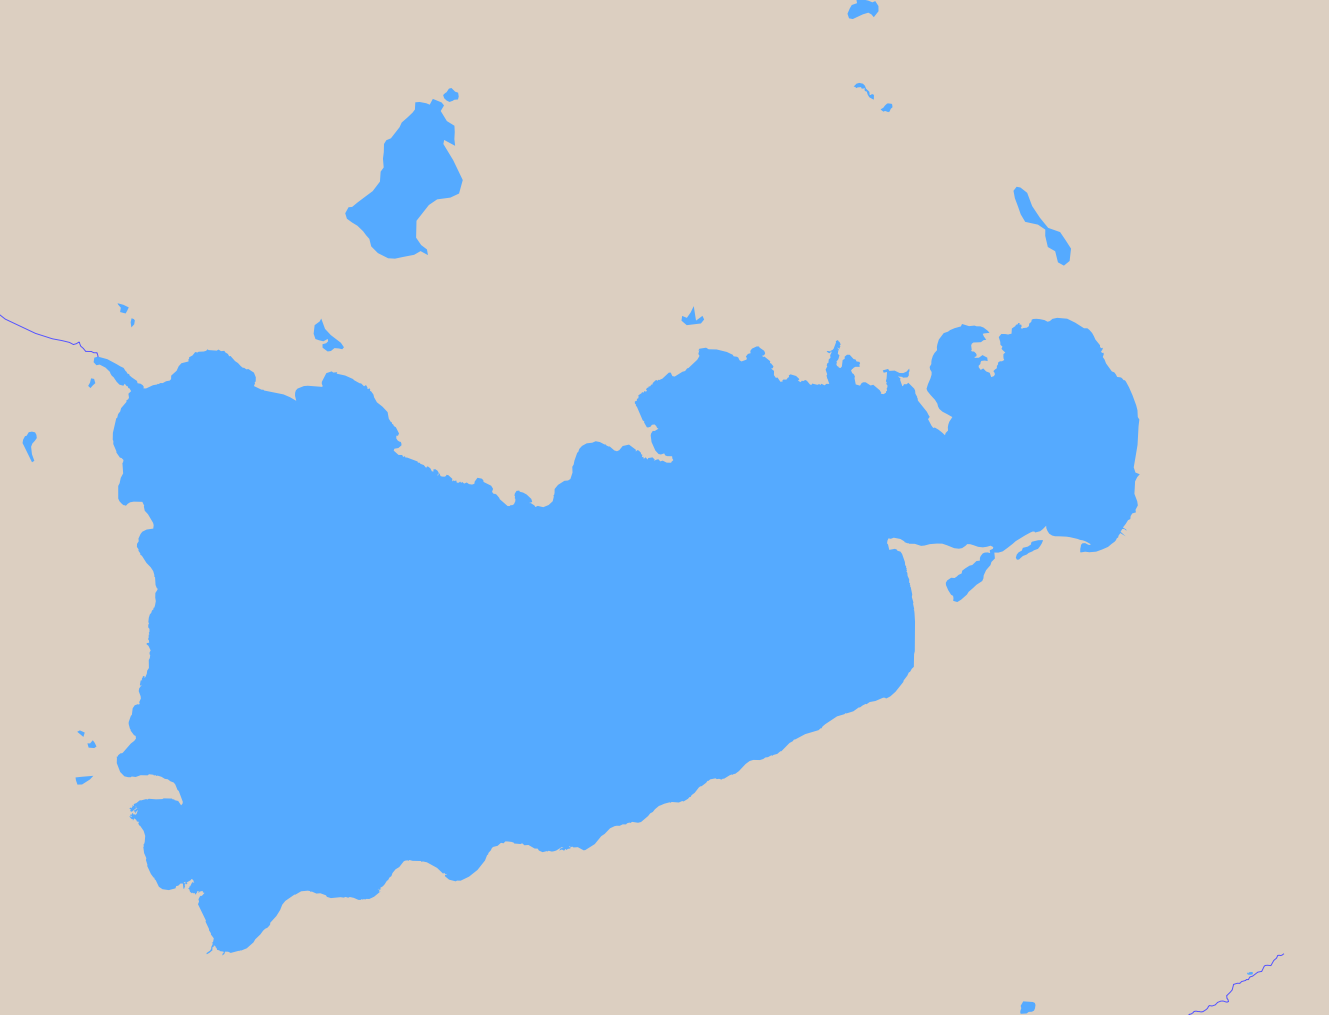
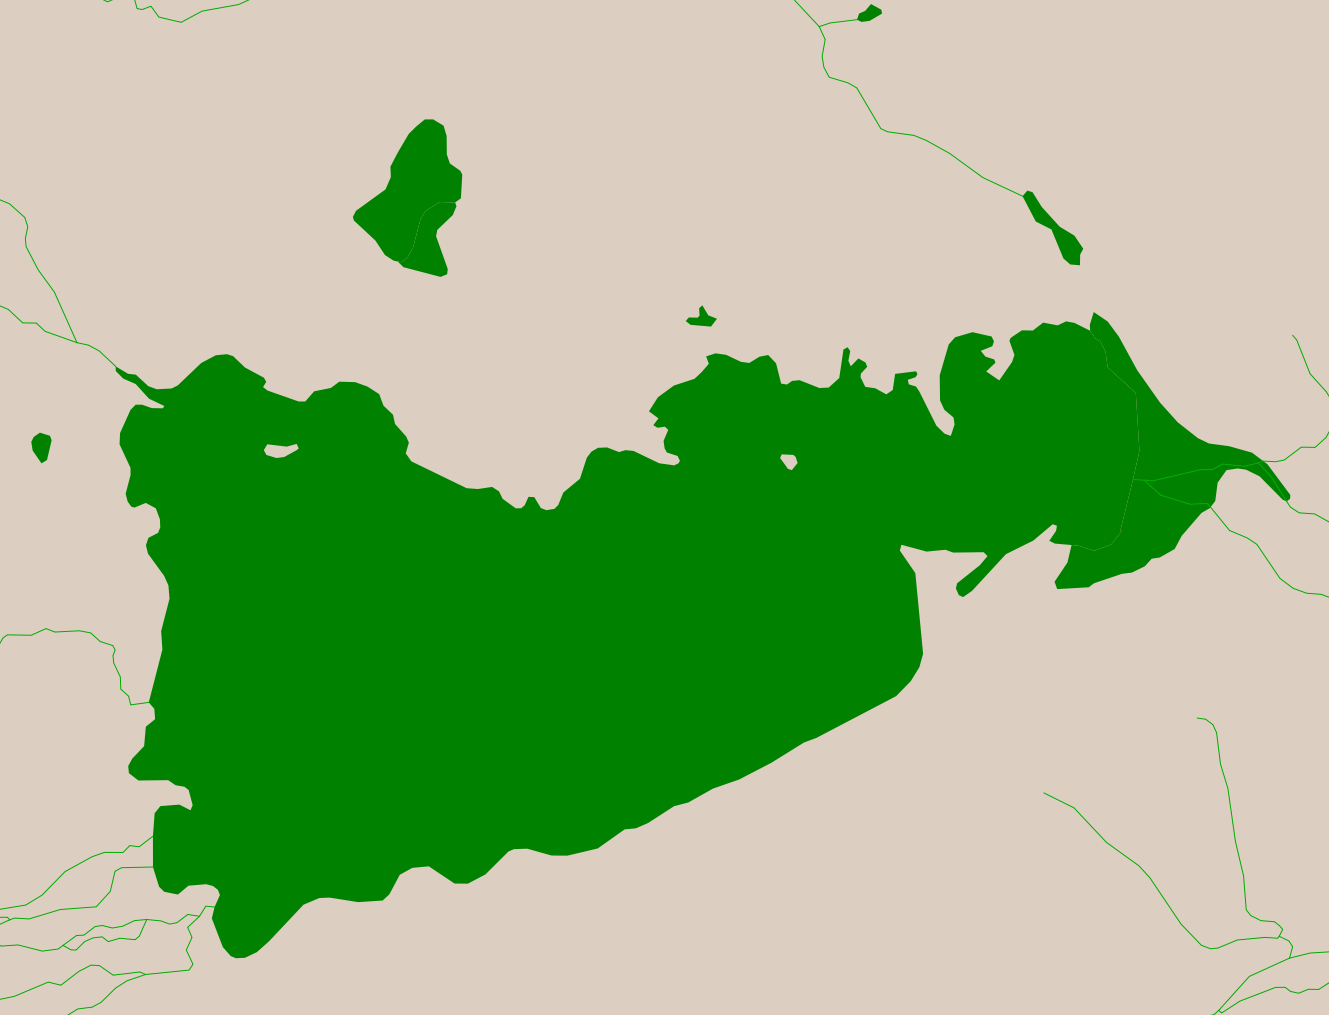
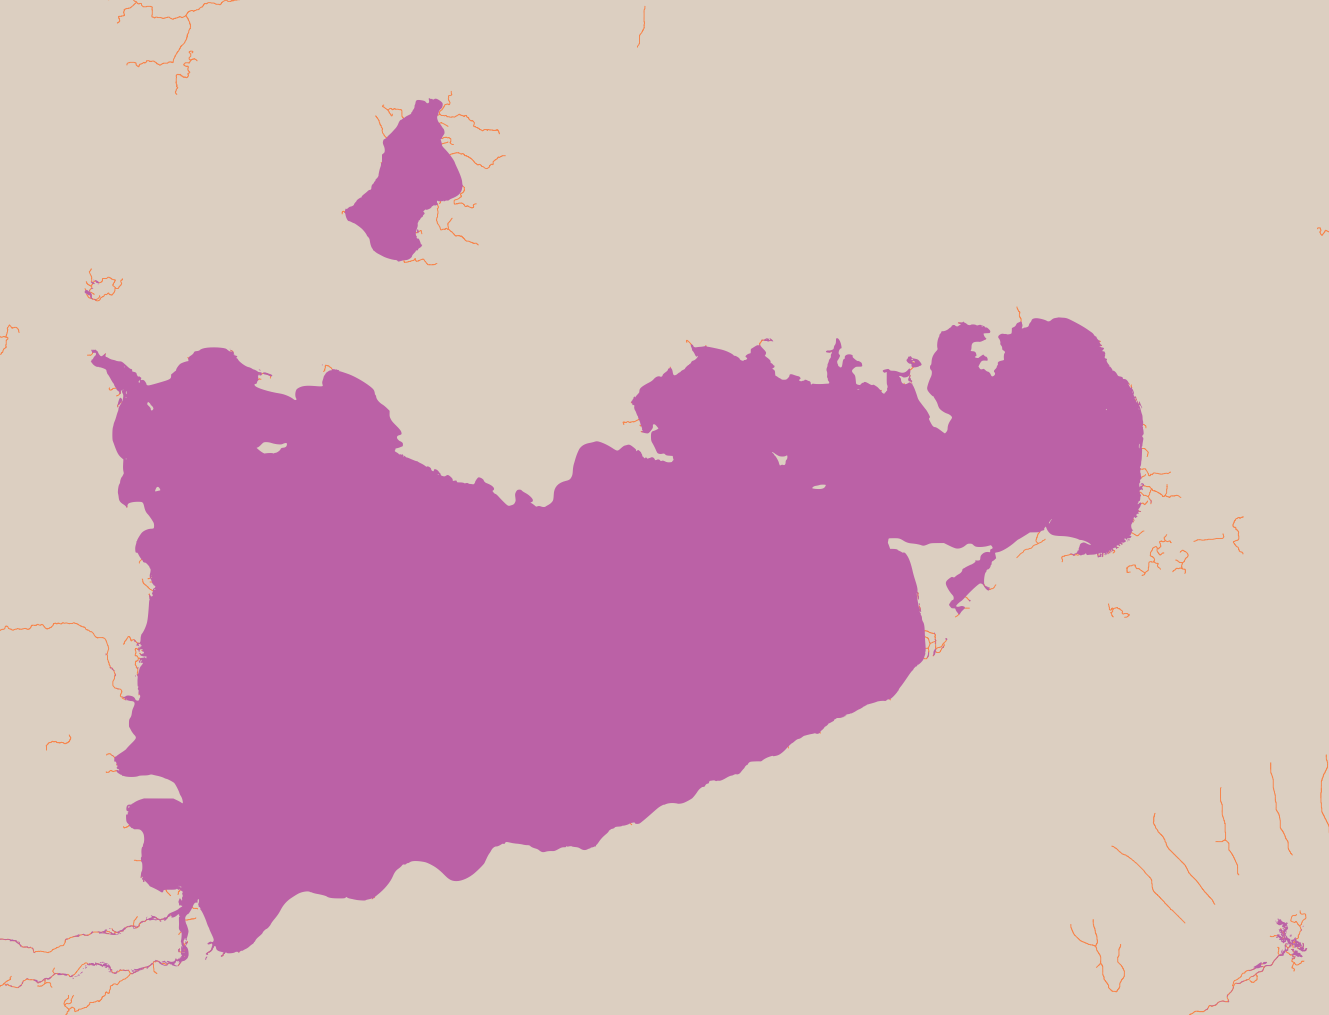
The images for the second area (around ![]() Namtso in Tibet) above show another issue specific to high mountain areas. Mapping the water bodies requires distinguishing them from snow and ice which is quite tricky. As a result the technique i used does not always reliably detect all water bodies there – in this case the smaller lakes around Namtso. On the other hand the islands in the lakes are well represented (
Namtso in Tibet) above show another issue specific to high mountain areas. Mapping the water bodies requires distinguishing them from snow and ice which is quite tricky. As a result the technique i used does not always reliably detect all water bodies there – in this case the smaller lakes around Namtso. On the other hand the islands in the lakes are well represented (they are missing in the Openstreetmap data In fact the larger ones are there, just in some unusual form that made me miss them during data extraction and only the two largest are in VMAP0).
In manual mapping of rivers it is much more work to produce a river polygon than a simple river line so in the Openstreetmap data polygons are only used occasionally on any but the largest rivers. The automatic approach does not have this problem so my technique generates a polygon as soon as the image data indicates a significant width of the river. This can be seen in the third sample area in the last image above.
Another word on resolution and accuracy: These are of course defined and limited by the source data used. SRTM elevation data comes in a resolution of 3 arc seconds. Landsat data has a higher nominal resolution but due to the orthorectification the actual accuracy is lower and comparable to the SRTM data. As a result the absolute positional accuracy of the river data (ignoring the matter of reliability for the moment) should be about 100m. The resolution, i.e. how small features can be to be still represented in the river data is close to the Landsat nominal resolution in those parts the water bodies can be reliably detected in the Landsat imagery.
What's important as well – since SRTM data is used in the process the resulting river data is well aligned to the SRTM topography so when producing maps combining this river data with SRTM based relief rendering there should be no larger mismatches.
Sample data download
Below you can find the data from the 4x6 degree sample region for download. The river polygon files do not contain any additional properties. The line files are structured in the following way:
- The river networks are represented in the form of line strings.
- The line strings only meet at their ends so if two rivers meet the major river line is always split at the meeting point.
- The river lines continue inside the river polygon areas, their course in those parts is arbitrary though.
- Each line string has the following properties:
ID:a unique ID given by the processing system, no particular ordercount:number of points of this segment in the internal raster representation used during processingc_landsat:number of points defined by landsat imageryc_srtm:number of points defined by SRTM datac_est:number of points estimatedc_osm:New in version 2: number of points derived from OSM dataua:uphill size of the river network above and including this segmentclass:uphill size of this river network at the point where it meets a larger networkclosed:1 if this segment is part of a closed loop, 0 otherwiseloop:1 if this segment is the closing (or bifurcating) element of the closed loop, 0 otherwise. Note this is somewhat arbitrary since most loops occur in flat areas where the relief used to determine this property is mostly noise.
As you can see the line data also contains information on the river network structure. You can use this to thin out the data to only maintain the larger rivers. Note that at the edges this data is not fully consistent since the data is clipped after processing (the actual processing area is somewhat larger).
In addition to the water body vector files a snow and ice mask is produced as a byproduct. Note this mask does not necessarily represent the permanent snow and ice. It essentially masks the minimum extent of snow and ice in any of the Landsat scenes used. It still might be useful for some purposes. The data is provided in form of an 8 bit GeoTIFF file.
This data is made available under the Open Database License: http://opendatacommons.org/licenses/odbl/1.0/. Any rights in individual contents of the database are licensed under the Database Contents License: http://opendatacommons.org/licenses/dbcl/1.0/. (This is the same license as the new Openstreetmap license)
- H46_v2_lines.zip (46 MB) zipped shapefile with the river lines
- H46_v2_areas.zip (10 MB) zipped shapefile with the river area and lake polygons
- H46_v2_lines_r.zip (8041 kB) lines of only the major rivers (without additional properties except for a clipped ua value that can be used as a hint for river size)
- H46_v2_areas_r.zip (1085 kB) areas of only the major rivers and lakes
- H46_v2_ice.zip (1842 kB) the snow and ice mask

Visitor comments:
no comments yet.
By submitting your comment you agree to the privacy policy and agree to the information you provide (except for the email address) to be published on this website.