

This is part three of a four part series of blog posts on the depiction of trees in maps – see part one for a discussion of tree rendering in traditional maps and plans and part two for mapping of trees in OpenStreetMap and rendering in OSM based maps.
Based on what i discussed in the first two parts of this series of blog posts, i have contemplated and experimented with new ideas for rendering trees in digital maps for quite some time. In the alternative-colors style i had already reverted the removal of tree depiction from z16 and z17 earlier. Since trees are important for many map users and mappers evidently invest a lot of time and energy in mapping them, degrading them to a POI of local importance is not a good idea in my opinion.
But the problems with the existing rendering in OSM-Carto otherwise remain:
- The transparency in rendering is not working well on the higher zoom levels (z18 and z19) where it applies to a larger area.
- The symbols use a lot of space and affect readability of the map, in particular in areas with dense presence of trees and this could even discourage mappers from mapping all trees in some cases. At the same time it is wasteful because it transports no information beyond the simple here is a tree while – as discussed in the previous post – mappers use all kinds of secondary tags to further characterize trees which could well be used for more differentiated rendering, in particular at the higher zoom levels.
- These problems will further aggravate if you’d want to extend the style to higher zoom levels.
I contemplated the idea of using profile symbols, because – as discussed – this is very common in traditional maps and it allows transporting differentiated additional information on the type of tree. However, this approach would not work too well at larger scales/higher zoom levels. And it does not provide very precise information on the position of the tree. As i showed, large scale plans typically use from-the-top view depictions and have developed a lot of useful design concepts in that domain. If you want to have a useful depiction of the tree size at these scales there is really no alternative to a from-the-top view.
The basic design concept
The basic design idea i have now implemented is using from-the-top view symbols in a line drawing design. If the symbol design is not too dense it allows features below the tree symbol to be visible through the line drawing – while being less distorted in coloring than with the semitransparent fill color of the OSM-Carto design.
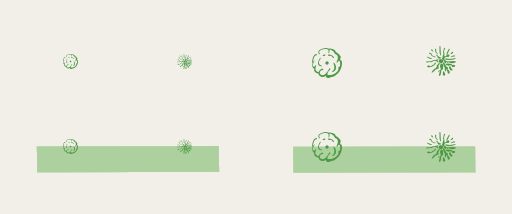
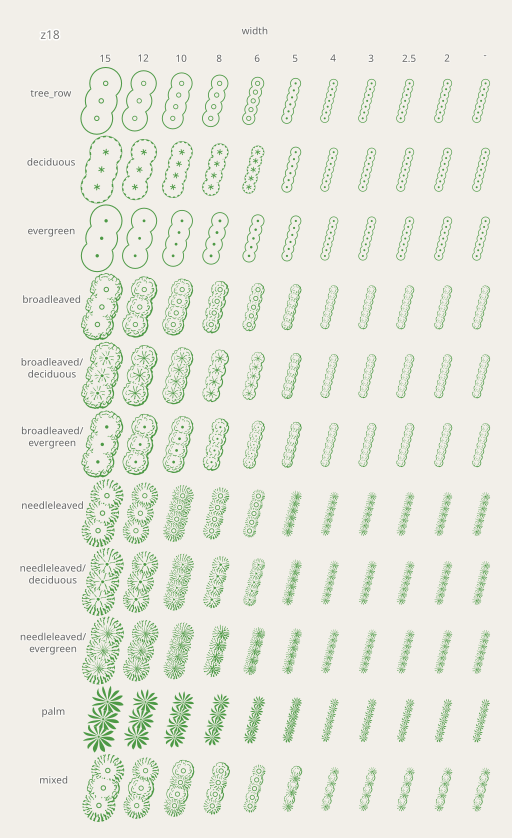
Tree depiction using line drawing symbols – left at normal scale (z19), right at double resolution rendering
| z16 | z17 | z18 | z19 | z20 |
|---|---|---|---|---|
 |
 |
 |
 |
 |
 |
 |
 |
 |
 |
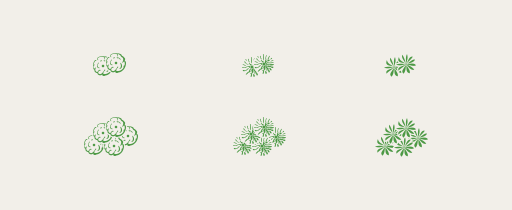
The difficulty is how to deal with symbol overlaps. I definitely wanted to retain the feature of tree symbols being non-blocking because trees frequently exist in dense groups and just rendering one of them in such cases is highly non-ideal. And in areas where there are a lot of POIs (like in dense urban environments) most trees would not be rendered if they were blocked by other symbols.
If you’d naively show line drawing symbols with overlaps you would often end up with a dense, non-discernible mess in areas with dense presence of trees. The technique of applying layer based opacity in OSM-Carto successfully avoids that – but only for a uniform fill color. I considered applying a structure pattern to a polygon aggregated from the buffers of the individual trees (a bit similar to the rendering of unpaved roads). But that would look rather crude for trees and would evidently be a solution just chosen because it is technically simple and not because it is good design.
The samples from architectural drawings and site plans i showed in the first part demonstrate a number of techniques how overlapping top view tree depictions can be handled graphically. None of the automated map rendering tools i know of has any kind of built-in support for anything like that though. What i ultimately ended up with is implementing the whole symbol drawing in PostGIS. This is certainly not very efficient (doing this at the compositioning level of the renderer rather than at the geometry processing stage would be much faster probably) but it is doable.
To make that possible, all the symbols were entered into a distinct database table as PostGIS polygon geometries and are then processed to generate the desired shapes to be then rendered just as if they were mapped geometries from the rendering database. This probably sounds more complex than it is in principle – though the geometry processing is certainly non-trivial. The route to get SVG symbols into a PostGIS database is via conversion to PDF using inkscape and then using OGR basic PDF support (with OGR_PDF_READ_NON_STRUCTURED). As an alternative route of symbol generation for simple abstract shapes i also implemented support for generating them using PostGIS code. Both routes can also be combined to supplement/edit a file based symbol with a PostGIS query. This is in particular useful for dynamically scaled symbols – as i will discuss in more detail below.
Handling of overlaps between tree symbols
Tree type depiction
As you could already see in the examples so far i designed different symbols for different types of trees. This is less easy to do in an intuitive fashion than for profile symbols but it is still manageable at least for the basic leaf_type and leaf_cycle classes.
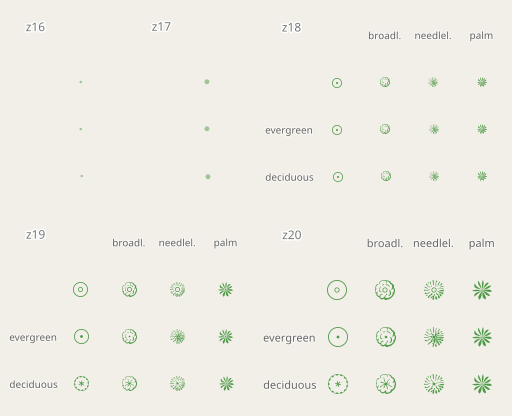
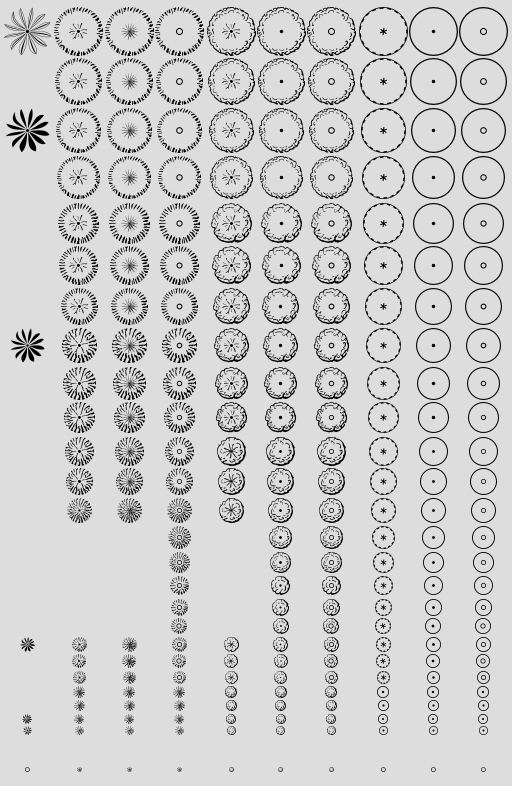
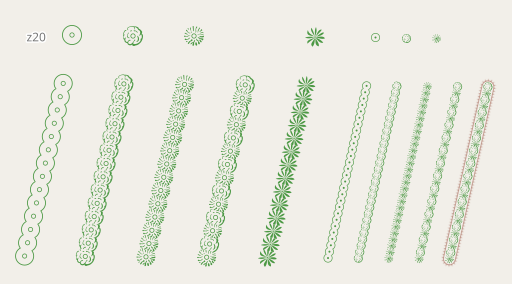
Tree symbols differentiated by leaf_type/leaf_cycle at z16 to z20
At z16 and z17 trees are – like in OSM-Carto before 2017 – rendered with a plain green dot. At z18 trees start being differentiated by leaf_type and from z19 on also by leaf_cycle. The illustration of deciduous leaf_cycle takes the form of a display of the major branches and trunk of the tree (as visible from above in the absence of foliage) or a cleared center area in case of the needleleaved symbol. The lack of a specified leaf_cycle is illustrated with a small circle in the center of the symbol. Palms (genus/taxon=Arecaceae) are shown with a distinct symbol (independent of the leaf_type/leaf_cycle tag).
Tree sizes
The other main feature for individual tree rendering i implemented in addition to the leaf_type/leaf_cycle depiction and the customized handling of symbol overlaps is dynamic scaling of symbols according to recorded information about the tree size.
Trees vary greatly in sizes – what is commonly mapped in OpenStreetMap as natural=tree might have a height of just 2-3m for a small ornamental tree up to more than 50m. Canopy diameters (diameter_crown) can range from a meter or less up to around 50m as well. Such information is not recorded for a large percentage of trees mapped in OpenStreetMap but in absolute numbers it is still quite a few that come with such data. And visualizing tree size information in the map at the higher zoom levels would increase the usefulness of tree rendering quite significantly.
With the top view visualization i have chosen here a natural way to visualize the tree size is by varying the symbol size based on the canopy diameter. This is also the way large scale site plans often differentiate trees – as i have shown in the first part of this blog post series. Just scaling the whole symbol however does not work very well for that. For a line drawing symbol, scaling the line work while maintaining the drawing width would be a possibility – that is what most of the mentioned site plans do. However this still can lead to the problem that smaller symbols would have a too detailed geometry while larger symbols are not detailed enough. I tried and implemented both the approach to design distinct symbols for different rendering sizes and to have parametrized symbol geometries that scale according to non-trivial rules. Here is how this looks like:
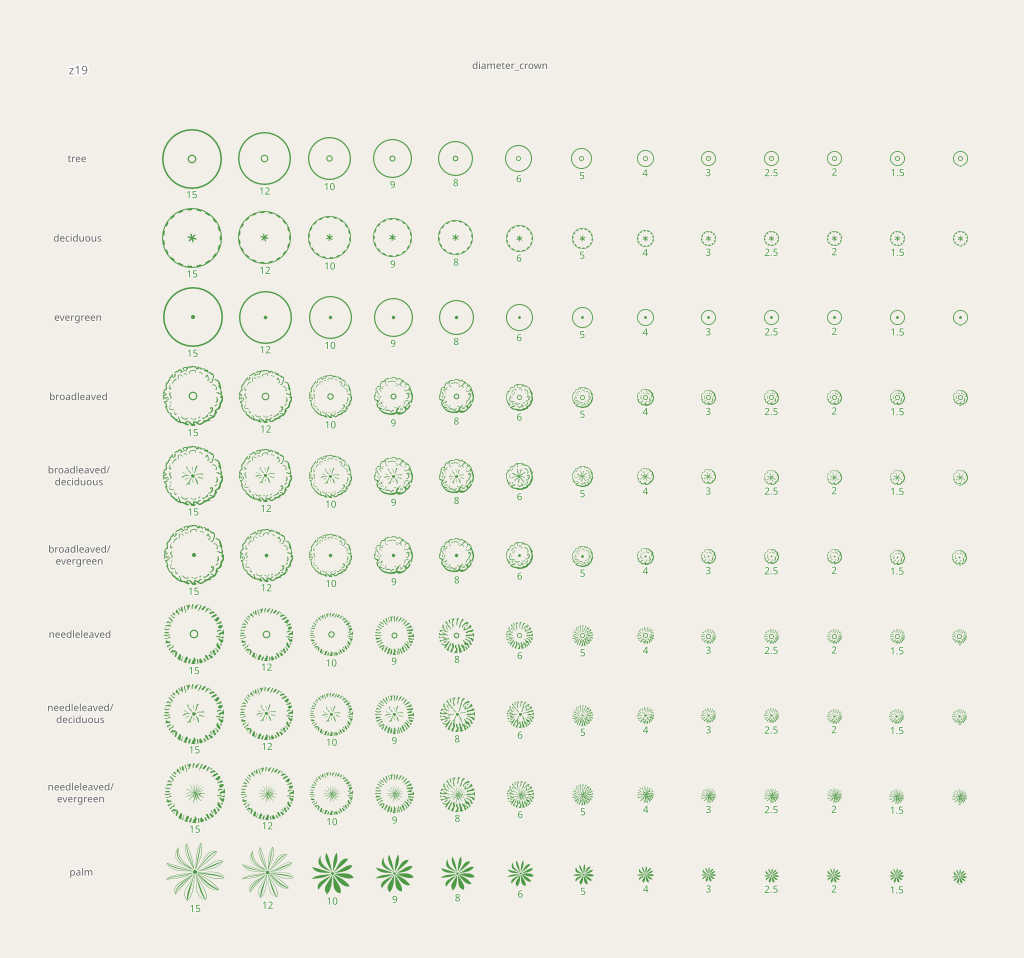
Trees with different diameter_crown values at z18 – click to see z19
To inspect the symbols in the symbols table i also created a separate map style file (treeinspector.mml) that visualizes the content of the symbols table as is. Here is how this looks like:
The symbols table inspection style
The symbols for palms exist only for the sizes they have been designed for. The renderer then picks the closest match in size and scales it to the tagged tree size, rounded to the next integer pixel size to ensure pixel alignment as far as possible. For the parametrized symbols (most of the larger ones) a separate symbol is pre-generated by the generate_symbols.py script for every integer symbol size. This is either fully generated by PostGIS SQL code (for the unknown leaf_type symbols on the right) or composed of a scaled SVG based design and additional parametrized modification via PostGIS (for the known leaf_type symbols). As you can see the overall size of the symbols are scaled while the line with of the abstract circles and the geometry of the center symbol is not in the same way (for larger symbols this also gets increased moderately). For the larger symbols with know leaf_cycle the center portion (indicating the leaf_cycle) is rendered at a constant size while the outer rim (which does not change with leaf_cycle) is scaled according to the symbol size. The definition of all these symbol generation rules can be found in symbols.yml.
In the above symbol table only odd sizes (in pixels) are shown above 17 pixels. Only those are used for the individual tree rendering to ensure a uniform pixel aligned rendering at different sizes. For the tree rows (see below), where the symbols are not pixel aligned, also the even sizes are used.
In case diameter_crown is not mapped for the tree an estimate is made from either the height (0.3 times the height) or the trunk diameter (5 times the diameter). This is implemented in the function carto_tree_diameter_mapped(). As with other cases of ground unit rendering i implemented in the alternative-colors style, the symbol size is chosen as the maximum of the default symbol size for that zoom level and the size as tagged or estimated based on tagged height or trunk diameter.
With the shown technique to cut out overlapping tree symbols there is also a possibility to indicate different tree heights separately to some extent by having the height define the drawing order. If the height is not tagged, the drawing diameter of the tree symbol (determined as described above) is used to define the drawing order instead. That of course means that small trees completely under large ones are hidden.
Overlapping tree symbols, ordered by tree height (at z19, with varying diameter_crown as well) click for double resolution rendering
Tree rows
One part of this tree rendering project i struggled quite a lot with are the tree rows. This is to a large extent because natural=tree_row is a fairly ill defined concept in OpenStreetMap. As mentioned in part 2 there is no established tagging to indicate the spacing of trees in a tree row and neither is there a clear agreement what qualifies a set of trees to form a tree row. A tree row might be
- four trees spaced 50 meters apart but planted evidently in a collinear fashion so forming an abstract row while not in any way forming a continuous object.
- trees along the edge of a road or stream which might have originally been planted in a systematic fashion but with – at present – irregular intervals between them.
- a dense arrangement of trees along the side of a agricultural plantation serving as wind protection.
- a regularly spaced line of trees in a tree plantation for agricultural purposes.
All of that might indiscriminately be modeled with natural=tree_row in OpenStreetMap. Visualizing that in a way that properly represents all of these cases in a decent fashion is next to impossible.
The traditional rendering in OSM-Carto is taking the simplistic approach to simply align the design directly to the data model. By rendering individual trees as a buffered point and rendering tree rows as a buffered line. While that is a reasonable choice to give the mapper very direct feedback to what they have mapped, it does not provide much support or guidance regarding the semantics of that mapping.
The approach i ultimately chose for tree rows is to render them like a line of individual trees with a relatively dense arrangement of individual tree symbols. But the cutting out of the individual tree symbols against each other is done in a different fashion, not prioritizing one symbol over the other but cutting them at the bisector between them. I am not sure if this is the best solution. But it is one that harmonizes quite well with the individual tree depiction and at the same time makes the results easy to distinguish from a line of trees mapped individually.
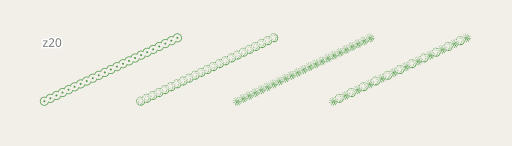
Tree row rendering with different tagged width values at z18
| z16 | z17 | z18 | z19 | z20 |
|---|---|---|---|---|
 |
 |
 |
 |
 |
 |
 |
 |
 |
 |
For efficiency in rendering – since all of this has to be done in SQL code on the fly – the individual tree symbols of the tree row are only cut against the previous and next point on the line which leads to some overlap artifacts in case of sharp corners on the line.

Tree rows with sharp corners at z19
Some might wonder why i have not used a line pattern to generate this kind of visualization. There are multiple reasons for that. First: line patterns in Mapnik don’t have support for line caps – which would not work very well for this use case. Second: Line patterns are drawn continuously along the length of the line and no special attention is given to corners in the line geometry. What you’d want, however, for tree rows (and especially also hedges – see further below) is that there is a tree symbol positioned at every node of the line to give proper visual feedback on the exact geometry. The additional tree symbols would be distributed between the line nodes until the desired point density is achieved (which can be done with ST_Segmentize() in PostGIS). This has the disadvantage that the symbol density along the line varies and the design needs to be robust enough to deal with that – which however is the case here. The third reason is that line patterns are always oriented along the line so there is no good way to implement a shading effect like i use in the tree symbols here.

Symbol placement on tree rows at z19
Shrubs/bushes and hedges
For rendering shrubs i chose the same design as for trees – but they only get rendered starting at z19 so there is not much risk of confusion. The symbols at z19 are already differentiated by leaf_type – but that difference is very subtle.


Shrub symbols differentiated by leaf_type at z16 to z20
Hedges are rendered like in OSM-Carto until z19 and get the tree row like differentiated design at z20.
Differentiated rendering of barrier=hedge at z20
For hedges i added rendering for the regional specialty in northern Germany called Knick (see the second part of this blog post series) – for which there is a tag in OpenStreetMap: hedge=hedge_bank. This is indicated in a similar fashion as i render implicit embankments on roads:
| z16 | z17 | z18 | z19 | z20 |
|---|---|---|---|---|
 |
 |
 |
 |
 |
 |
 |
 |
 |
 |
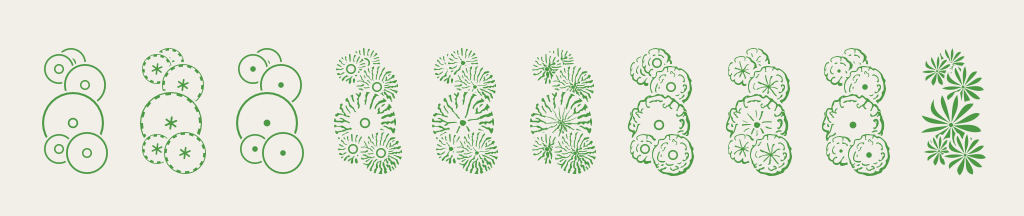
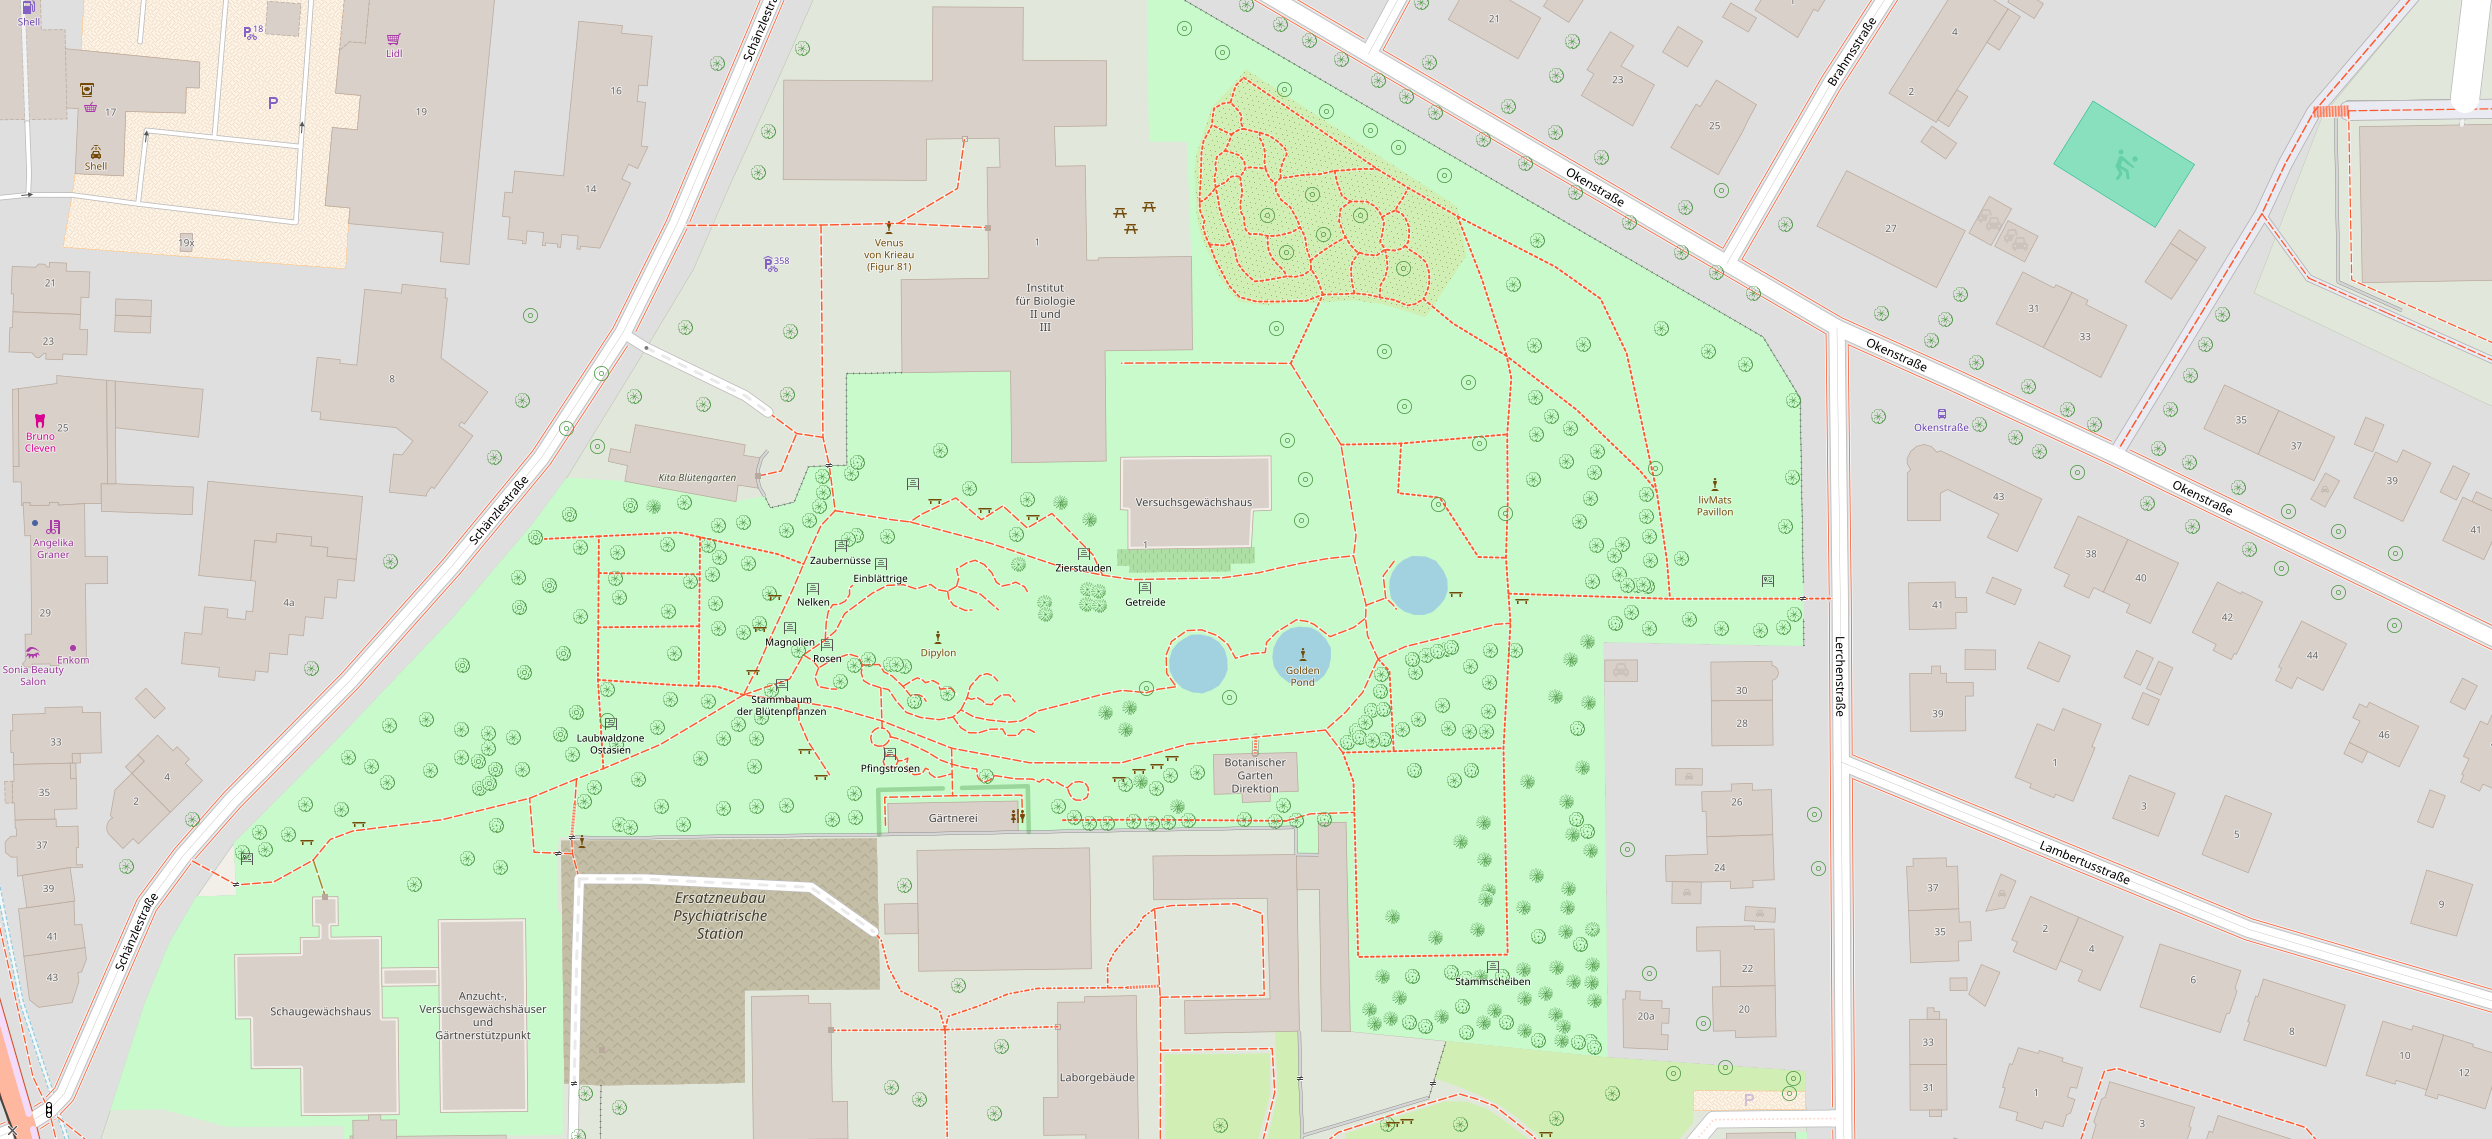
And here trees, shrubs, tree rows and hedges of various types at z20 for comparison.
Trees, shrubs, tree rows and hedges at z20 all together
Real world examples
And for the end of this part after all the abstract examples illustrating the design in principle, here a few examples based on actual OpenStreetMap data. More samples can be found on the Alternative-colors style sample gallery and on my style comparison page.
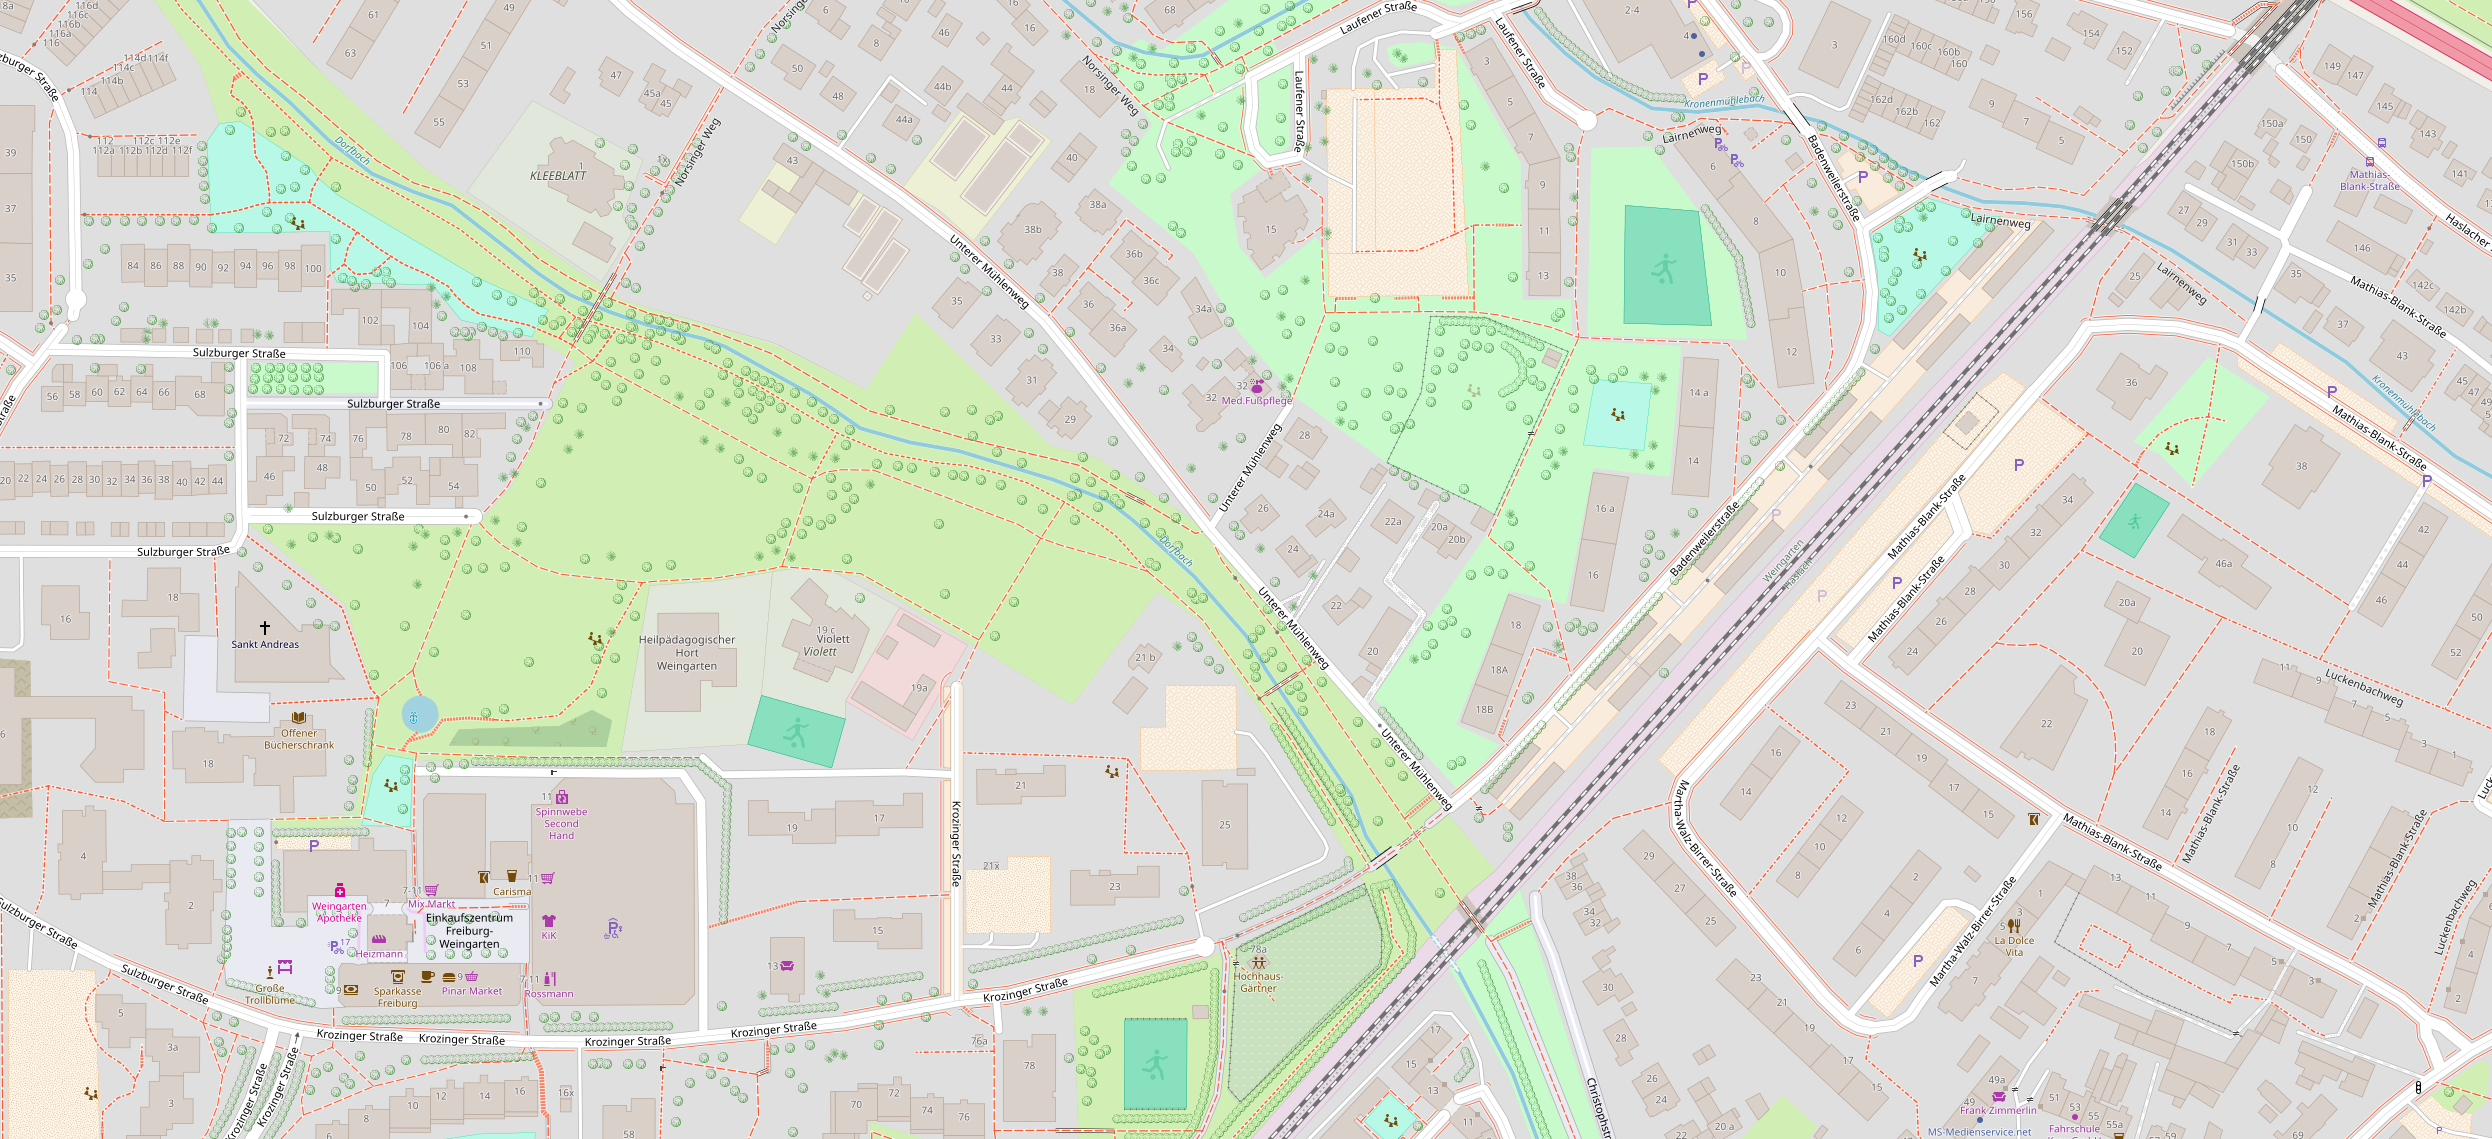
Freiburg, Germany, z18
Freiburg, Germany, z19
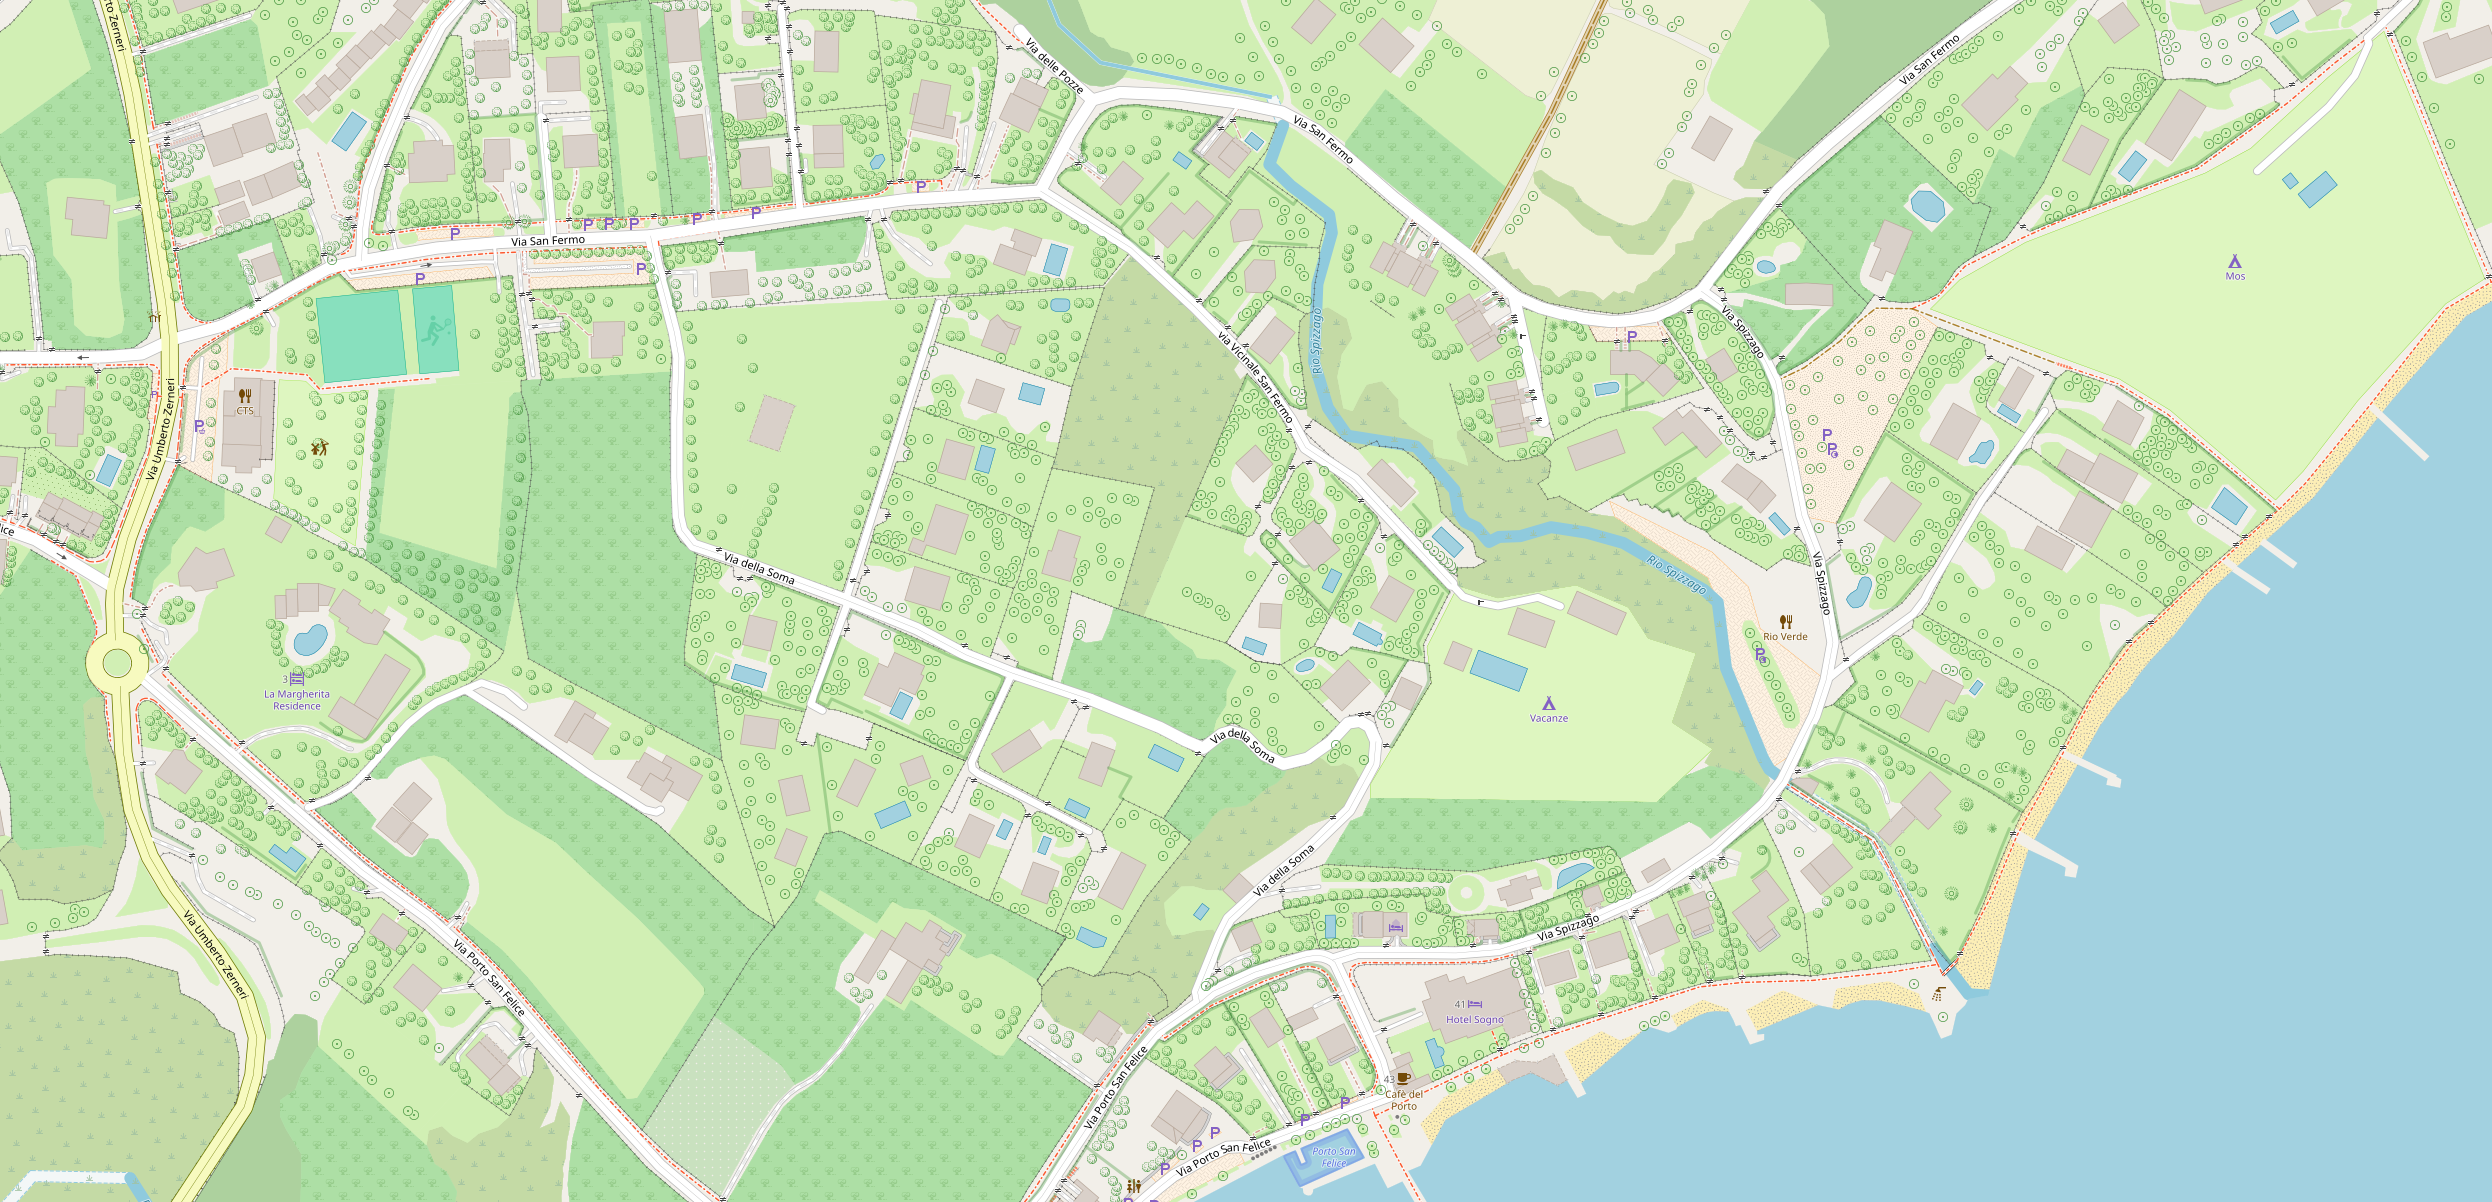
Lago di Garda, Italy, z18

Lago di Garda, Italy, z19
Lago di Garda, Italy, z20
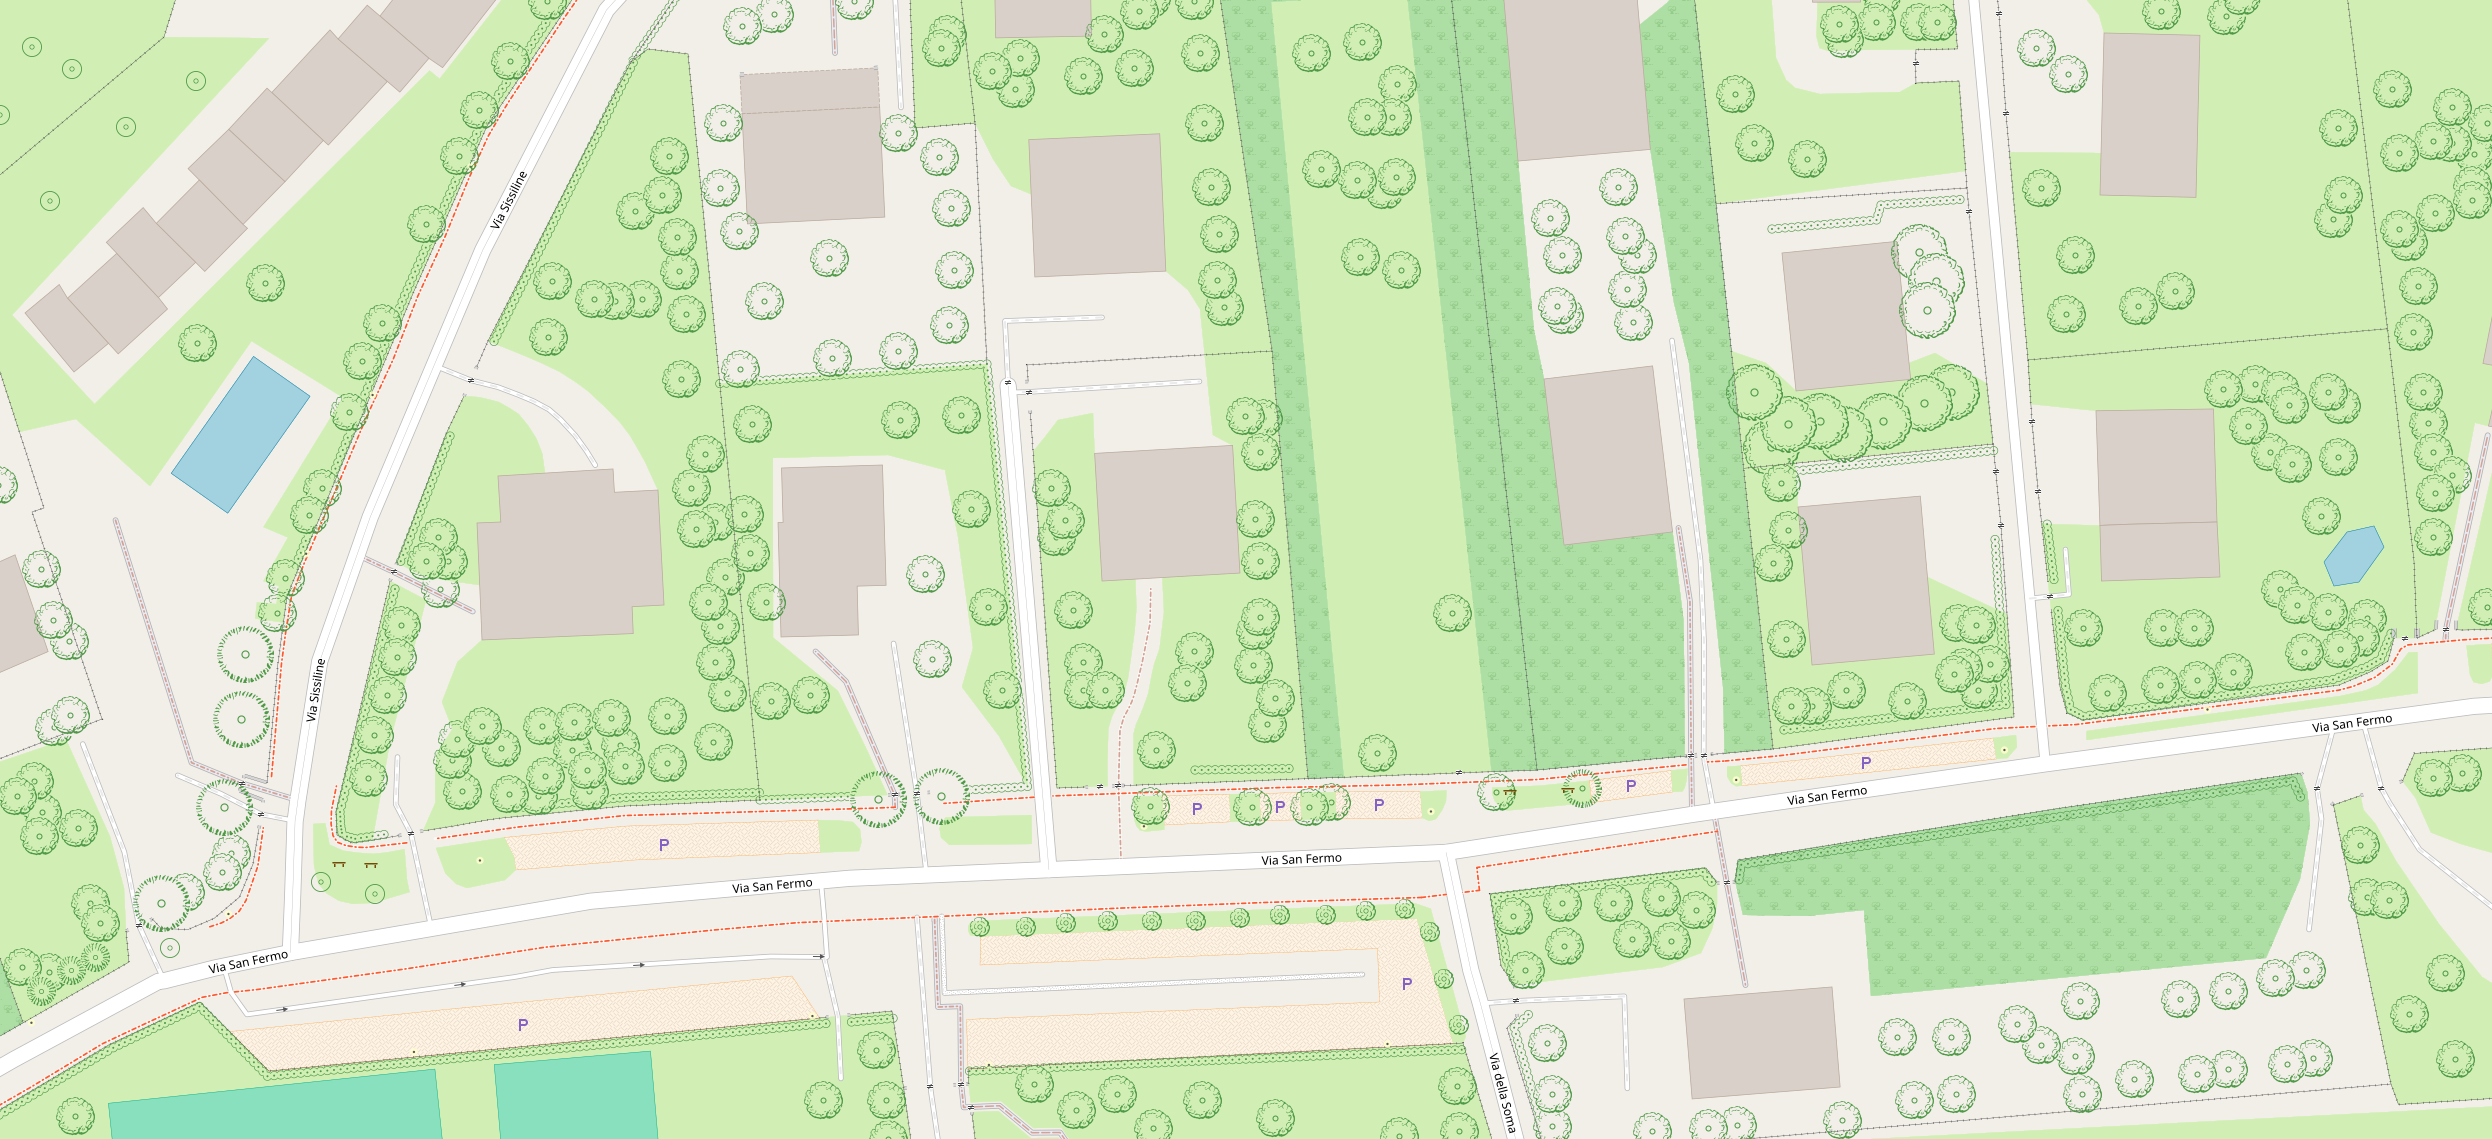
Strasbourg. France, z18
Strasbourg. France, z19
Aukrug, Germany, z19
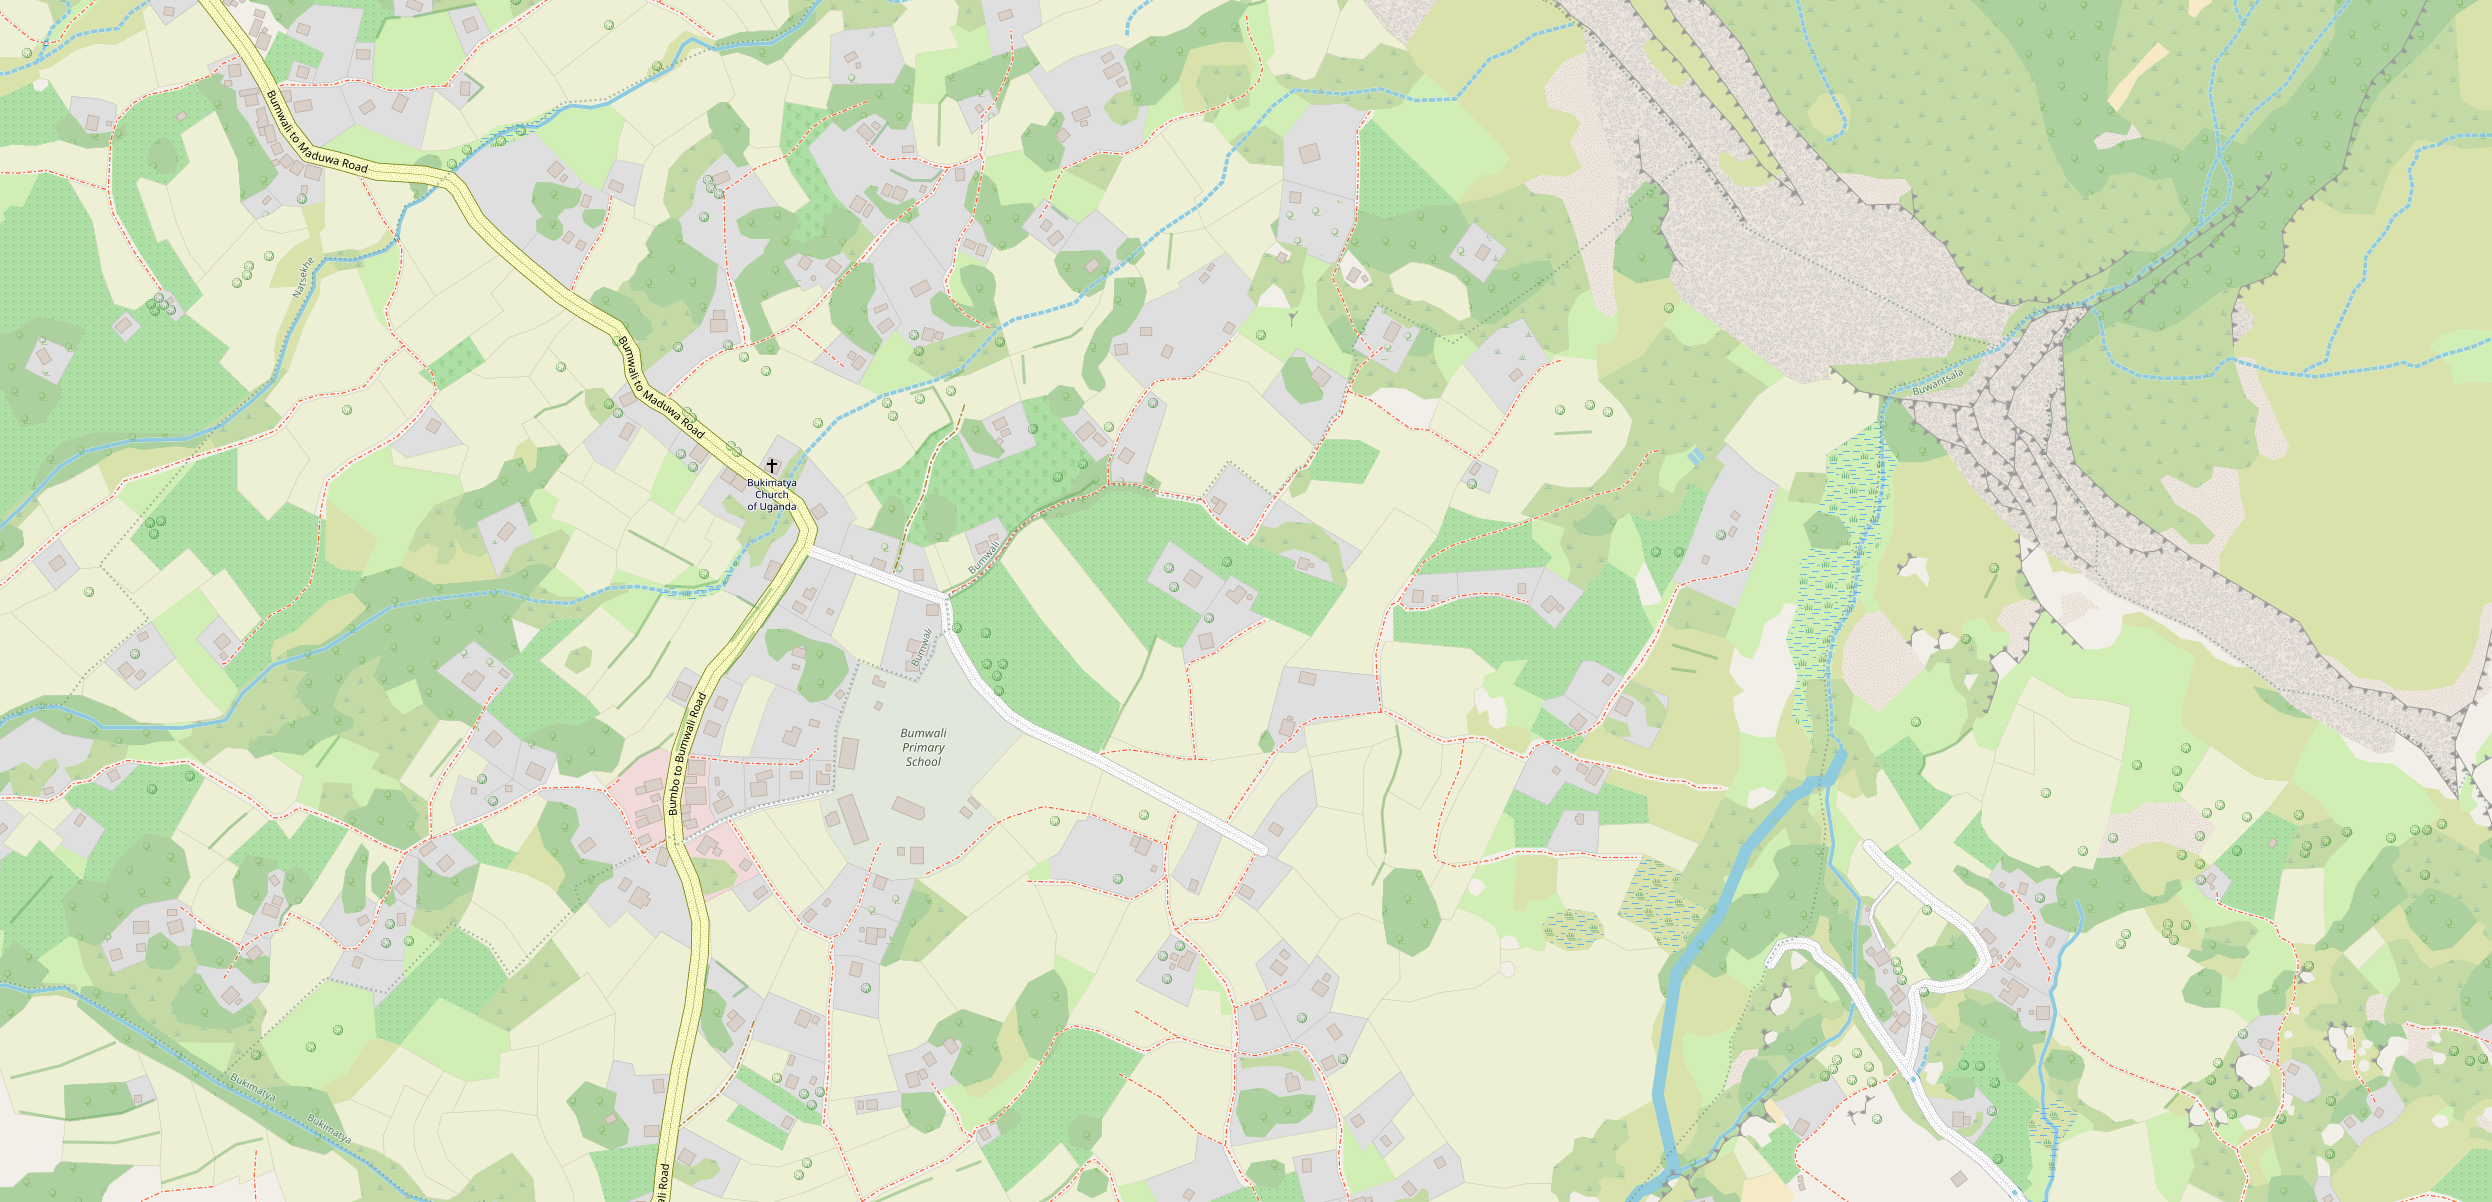
Bumwali, Uganda, z18
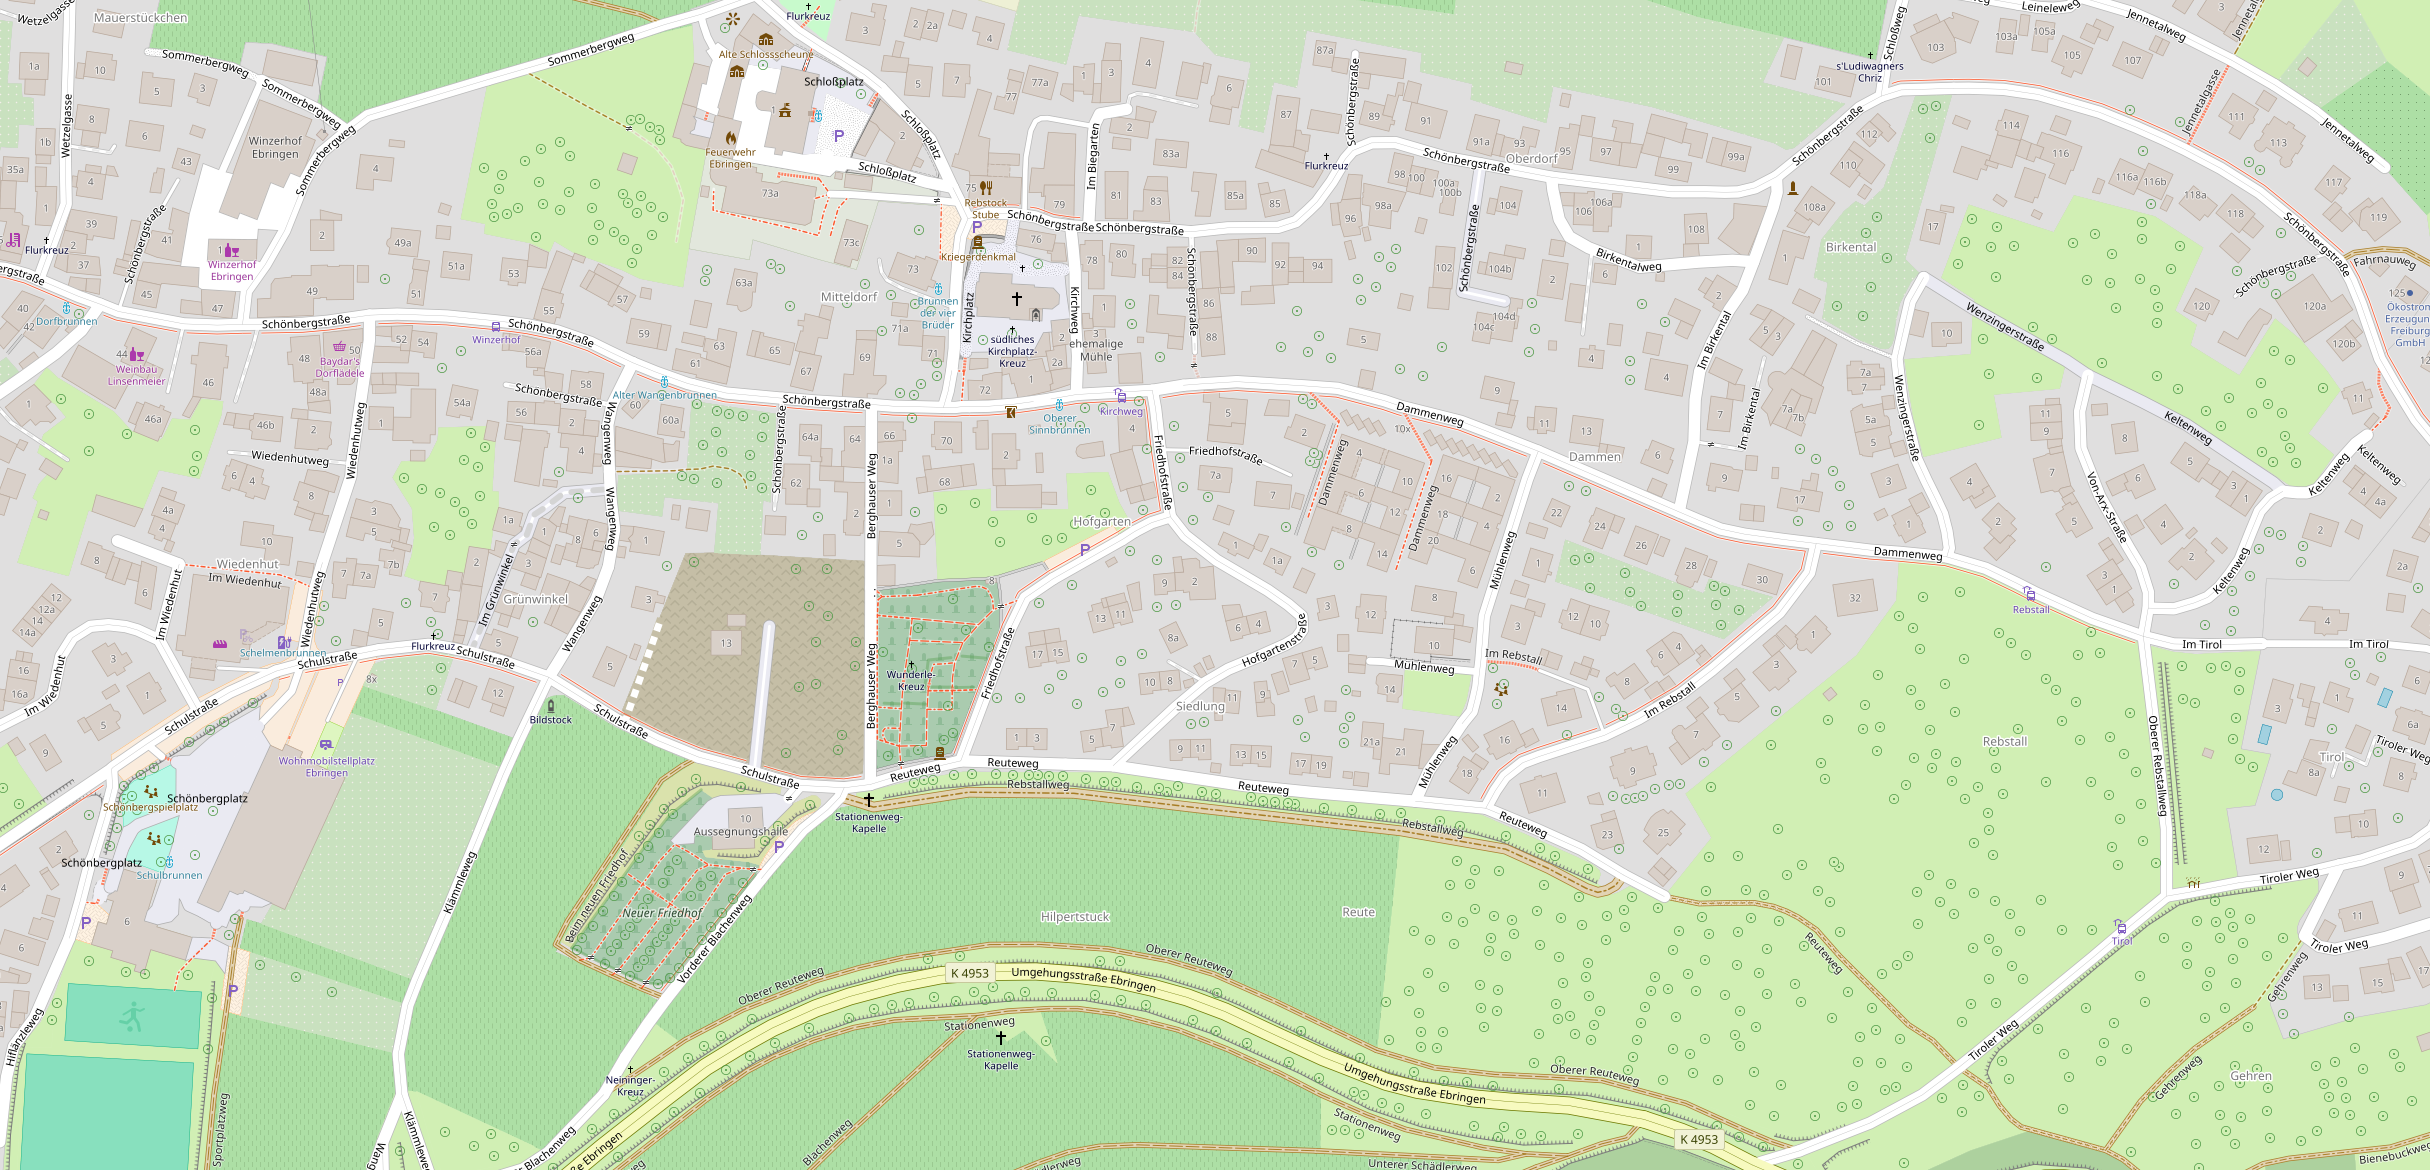
Schallstadt, Germany, z18
The fourth and last part of this series of blog post is going to provide some discussion and conclusions on the subject of individual tree rendering in digital maps.
June 5, 2022 at 16:44
Nice work! It would seems interesting to me to check on places where the forest is gradually letting place to meadows, like here : http://www.opensnowmap.org/#map=15/6.44/46.803 . Yves-opensnowmap.
June 6, 2022 at 08:24
Sorry, wrong URL http://www.opensnowmap.org/#map=15/6.443/46.806&b=snowmap&m=false&h=false
June 6, 2022 at 12:05
Absolutely amazing work, which for me cements your status as one of the leading digital cartographers!
Two thoughts: 1) have you experimented with always rendering the trunk circle for overlapped trees, even if the central area is overlapped by another crown? I found the examples with partially rendered crown but no trunk a bit disturbing. 2) for me, the shade of green you picked for the crown symbol is a bit too dark, I feel it is overpowering the map if one tries to not focus on trees.
Again, great work!
June 6, 2022 at 13:43
Thanks for the comments. Yes, the overall weight of the tree depiction is something i am still contemplating. I have made multiple adjustments to symbols in that regard during development. At the moment i have the impression that many of the larger symbols are still a bit heavy. I don’t think a lighter color would make it better though since it will make symbols selectively less visible on dark backgrounds.
No i have not tried to exempt the center dot of symbols from the cutting out. There are two ways this could be implemented: Not cutting out at all would need to interferences between overlapping symbols (which is bad for readability). The other option would be to separately render the center dots with priority over the crown symbols and cutting space for the center dots out of those. I have not tried this but it would make the whole rendering much slower because you would have more cutting operations to do.
Pingback: weeklyOSM 621 | weekly – semanario – hebdo – 週刊 – týdeník – Wochennotiz – 주간 – tygodnik