With the recent introduction of additional imagery layers for the purpose of mapping in OpenStreetMap by DigitalGlobe significantly more source material is now available for remote mapping in OSM. However in many, especially remote areas my OSM images for mapping still provide the most recent image source readily available for mappers and in quite a few areas also the best overall. And even in areas where recency of images is not that important and where Bing and DigitalGlobe offer good quality images an additional independent image source can be very useful for interpretation.
I added a few additional images now with a focus on coastal areas and tidal flats. Areas with changing water levels are something where open data imagery is of particular use even if higher resolution images are available from other sources because you can specifically select high and low water levels and are thereby able to accurately map the coastal features while in higher resolution image sources you tend to have more or less random water levels in the images and essentially need to map based on guesswork if you do not have additional sources of information.
Mapping coasts and the tidal zone in OpenStreetMap is not that difficult, here the basics:
- the coastline tagged with natural=coastline is placed at the top of the tidal range.
- the tidal zone is usually mapped as as natural=wetland, with wetland=tidalflat if it is bare mud or sand, other wetland types (like wetland=saltmarsh or wetland=mangrove) apply if it is vegetated.
- shallow, elevated areas permanently under water can be mapped as natural=reef.
- sand- and gravel bars in the tidal range or raising above can be mapped as natural=shoal.
- non-vegetated coastal stretches of sand, gravel or pebbles that are formed by waves can be mapped as natural=beach – preferrably with a surface tag indicating the material.
- rocky coasts can be tagged natural=bare_rock, coastal cliffs can be mapped with natural=cliff.
- for coastal dunes you can use natural=sand, individual dunes can also be mapped with natural=dune.
Much of this is of course rather difficult to assess without local knowledge so be careful when mapping just from the distance and familiarize yourself with the area in question before you do so. In many of the areas i show in the following at least the basics, delineating the coastline and mapping the tidal flats, are not that difficult to do though.
You can find some more details on coastal mapping in another blog post about beaches and reefs.
Bahía Blanca
Bahía Blanca is the name of a city as well as a bay in Argentina and features one of the largest tidal wetlands in South America which is currently quite poorly mapped in OpenStreetMap. I added images featuring a low and high water level.

Bahía Blanca low tide

Bahía Blanca high tide
Note these are from different times of the year so differences in color are not exclusively due to the tidal cycle. The whole area is also covered in high resolution image sources but with randomly varying water levels so accurate mapping is quite difficult just based on these.
Cook Inlet
Cook Inlet is the large bay in southern Alaska which features quite large tidal flats at the northern end near Anchorage.
This late summer image also allows mapping in the mountains around the bay. The area is partly covered by high resolution image sources but largely from less than optimal recording dates.
Bogoslof Island
Also located in Alaska is Bogoslof Island where a volcanic eruption recently changed the shape of the island quite significantly. See also here.
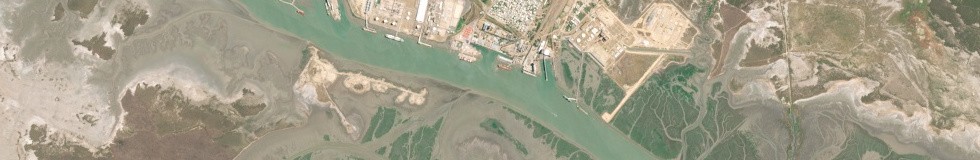
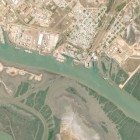
Northern Dvina delta
The situation for the Northern Dvina delta near Arkhangelsk is similar to that of the Cook Inlet although existing mapping on land is already much better here. I also provide a low tide image for this area that should allow adding details of the tidal zone.
Aral Sea
Finally i also have two images of low and high water levels of the Aral Sea which is of course not a sea but a lake. Exact water levels vary significantly from year to year but these images will at least roughly indicate which are permanent and and which are intermittent water areas at the moment.

Aral Sea low water

Aral Sea high water
There is some residual ice on the water in the northern part of the high water level image that should not be mistaken for something else. Note the right tagging for seasonally water covered areas is natural=water + intermittent=yes or seasonal=yes, not natural=wetland – even if intermittency of water areas is not currently shown in the standard map style.