When I wrote previously about the quality of the OpenStreetMap waterbody data one major problem – just like in case of the coastline – was that without a reference data set you cannot say much about the quality and completeness globally. If you work with the data you get a fairly good idea of where it is reliable and where not. For the coastlines i assembled a list of errors based on this for example. But you can never be sure you have not missed the largest flaws.
Recently Stephan Knauss presented an interesting comparison of Google and OpenStreetMap data including waterbody information. This got me thinking that an equally incomplete map like Google’s is of course not the best choice of reference if you want to reliably determine where data is missing or wrong, But there are other data sets for waterbodies that – while not providing a level of detail comparable to either OSM or Google – contain data of globally much more uniform quality. One of these is the MODIS land water mask which provides a global 250m resolution coverage of the land-water-distribution of the planet.
Now i take those two data sets


and calculate the difference leading to a map showing two things:
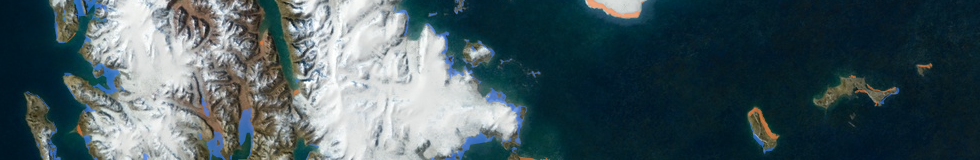
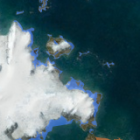
- The areas registered as water in the MODIS land water mask but not mapped as water in OpenStreetMap. These are potentially missing waterbodies in OSM and are shown in blue in the following maps.
- The areas mapped as water in OpenStreetMap but not registered as water in the MODIS land water mask. These are possibly areas incorrectly mapped as water in OSM and are shown in red/orange in the following maps.
Here a few examples of the results in various areas around the world. The links go to the full map.


This is not fully reliable of course. Apart from the limited resolution there are the following major issues:
- Quite a lot of the blue areas are not actually missing in OSM but simply damaged multipolygon geometries. If you see an area in blue that also shows up in the background OSM map this is most likely such a case (and could use fixing).
- The analysis does not take tags like intermittent into account, therefore many of the red areas are actually at least sporadically water covered but dry most of the time so they do not turn up in the reference data.
- The reference data is both outdated in parts and not very reliable in others. This applies in particular to glacier areas which are frequently wrongly detected as water. Most of the blue areas in Greenland for example are false alarms. I already excluded Antarctica from this analysis because here the OSM data is universally more accurate than the reference. Elsewhere the reference data contains excessive water extent in seasonally flooded river plains.
None the less you can see in the above examples that this can help to identify missing features and inaccurate mapping – often better than visual comparison with satellite images which is usually a needle-i-a-haystack problem.
In addition i rendered a new density map for the water features in OpenStreetMap – similar to those i showed about a year ago, the first with the waterarea density in red and the waterways in blue:
The second with waterway=river in red and waterway=stream in blue: