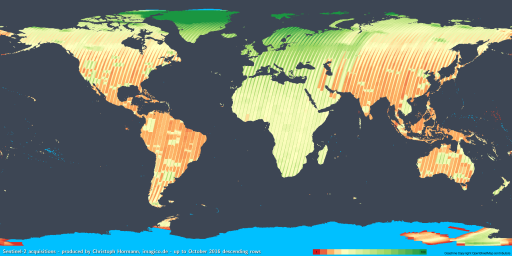
Sentinel-2 is an earth observation satellite mission producing open data imagery, the first satellite of which was launched in June last year and for which the data started to become available in November last year. The Sentinel-2 design is quite similar to Landsat and with a slightly higher spatial resolution of 10m it produces the highest resolution open data satellite imagery available at the moment.
This is to be a review of the image coverage generated by Sentinel-2 during the first year of operation. But for reference i will start with Landsat.
Landsat
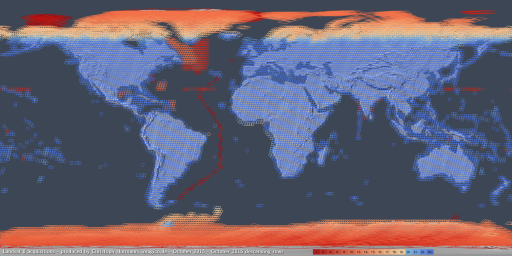
Landsat 8 has now been operating for more than three years and as indicated before it is essentially recording a relatively bias free global coverage of the land surfaces at a 16 day interval now. To illustrate here a plot of last years day side (descending orbit) acquisitions. This is generated by plotting the WRS2 footprints in a color representing the number of scenes available. This is fairly easy to do using the bulk metadata packages made available by the USGS.
The timeframe is not chosen arbitrarily, a mid October cut includes exactly one full northern hemisphere and southern hemisphere summer season.
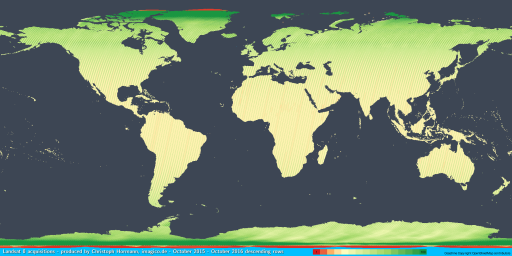
As you can see for low latitudes the map is quite uniformly colored indicating 21-23 acquisitions on most major land areas, corresponding to the 16 day interval. At high latitude not all possible slots are recorded but as the denser lines already hint this does not necessarily mean less frequent image coverage. To better show the actual image recording frequency here a different visualization indicating the per-pixel image count for all pixels that include land areas.
Here you can see that the high latitudes are actually more frequently covered in most cases – which is not a bad choice since cloud incidence here is often higher than in the subtropics.
A few interesting observations can be made here. First you can see the off-nadir recordings in northern Greenland and the Antarctic extending the coverage and reducing the area not covered at all, which is drawn in blue. This is the central Antarctic of course but there are also two pixels further north that are blue:
- Rockall – which is not really large enough to be recorded on Landsat imagery in any meaningful way.
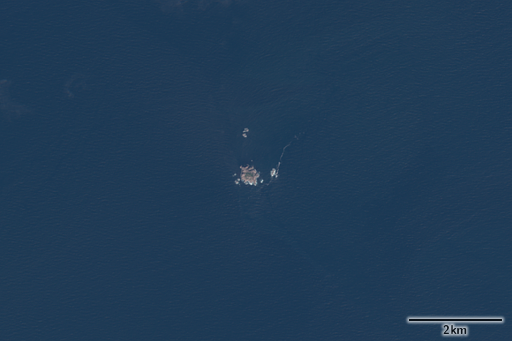
- Iony Island – which is a clear omission since other smaller islands elsewhere are specifically covered by Landsat.
Here this island on a Sentinel-2 image:
Apart from these the lower latitudes are recorded at every opportunity so there is not much that can be improved here. At the higher latitudes there is however still quite a bit of focus on some areas and neglect of others. In particular the islands of the Kara Sea and the East Siberian Sea as well as Bear Island and Hopen south of Svalbard are significantly less often covered than other areas at the same latitude. This is of course in a way a matter of efficiency since recording a scene containing only a small island is less useful overall than recording one that fully or mostly contains land surfaces.
For comparison and completeness here are the same illustrations for the previous years:
| year | day | night | day pixel coverage |
|---|---|---|---|
| 2014 | LS8, LS7 | LS8 | LS8 |
| 2015 | LS8, LS7 | LS8 | LS8 |
| 2016 | LS8, LS7 | LS8 | LS8 |
Sentinel-2
Now to the main subject, the first year of Sentinel-2. Public availability of images started in November but quite a few images were already recorded earlier and made available over time so i will use the same end cutoff as for Landsat (mid October) and an open beginning and call it a full year. This results in a bit of a bias towards the northern hemisphere since summer images for it are included for both 2015 and 2016.
Technically doing this for Sentinel-2 is much harder than for Landsat for multiple reasons:
- Since ESA does not provide a bulk metadata download option you have to scrape the API for this.
- The API – in addition to being very unreliable recently is also not always returning all the matching packages for a query – at least not the search API, the OData API is different.
- Not all packages in the ESA database have footprint data.
- Packages extending over the 180 degree meridian have invalid footprints.
- As mentioned in my initial Sentinel-2 review the scene footprints of the early data sets were mostly bogus. ESA fixed that in July but many of the earlier packages have not yet been replaced.
- Some early packages from 2015 have incorrect relative orbit numbers.
All of this together means quite a lot of effort is required to generate a halfway accurate coverage analysis. The following has still quite a few limitations:
- It only includes descending orbit images. Since Sentinel-2 does not have thermal infrared bands nighttime acquisitions are fairly rare anyway – so because of the complications i left them out.
- Images with missing footprint data or wrong relative orbit numbers are excluded (a few hundred overall).
- Images with old style bogus footprints were clipped to the recording swath limits but not in orbit direction. Therefore coverage is systematically overestimated, in particularly in areas with relatively fine grained acquisition patterns. This can well be seen in the smaller green areas in America and Asia which in reality are significantly smaller than indicated by the illustration here.
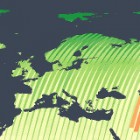
Still overall this should give a fairly precise image of the coverage patterns and recording priorities of Sentinel-2 during the first year of operations:
As it is already widely known Sentinel-2 operations do not aim for a globally uniform coverage. Focus is – at least for the last year – on Europe, Africa and Greenland. With a 10 day revisit interval Sentinel-2 could theoretically record 35 images per year for any single spot on the earth surface – although volume wise probably not for all the land areas at the same time. Understandably during the first year it did not reach this outside the overlaps anywhere although for the priority areas (Europe and Africa) it did match or even exceed the recording frequency of Landsat. Elsewhere however recordings were more sporadic and the smaller focus areas seem fairly arbitrary, probably meant to cater certain vested interests. This is particularly striking in the Antarctic where the interior is mostly uncovered but there is a smaller mostly featureless area on the East Antarctic plateau which has been repeatedly recorded for some reason.
Apart from the Antarctic and northmost Greenland completely uncovered areas are mostly smaller islands.
What the image does not tell is how well time slots are managed in the areas where images are not recorded at every opportunity, in particular with regards to cloud cover. With Sentinel-2 the area where this applies is much larger (i would estimate about two thirds of the land surfaces compared to about one third with Landsat). My gut feeling is that the USGS is doing better here – which would not be surprising considering the much longer experience. It might be interesting to look at the cloud cover estimates of the images in comparison although these are fairly unreliable and produced with different methods so in the end probably not really that meaningful. And as mentioned before the larger image size of Sentinel-2 also means cloud cover based scheduling is more difficult here.
Outlook
So what is to be expected for the next year. For Landsat not much is likely going to change. For Sentinel-2 the current statement is
Sentinel-2A is acquiring Europe, Africa and Greenland at 10 days revisit, while the rest of the world land masses defined in the MRD are mapped with a 20 days revisit time.
As indicated previously such statements, especially regarding the MRD, have to be taken with a grain of salt. The above would mean a significant increase in the recording frequency overall as well as a more uniform global coverage – the past year as illustrated above showed in parts more than a 1:2 difference between Europe and Africa on the one side and America and Asia on the other.

