To illustrate the difficulties of assembling cloud free satellite image mosaics i tend to use the analogy of trying to photograph an elephant running through a dense forest at a distance and changing its color like a chameleon while doing that.
This metaphor is meant to illustrate the two primary difficulties of image assembly – the dense forest stands for the clouds while the chameleon nature illustrates the changing appearance of the earth surface over time. Now most efforts in satellite image assembly and most research and discussion going into that tends to focus on the clouds – they are an universal and unavoidable problem you have to deal with when working in this field. The changing appearance of the earth surface on the other hand is not usually given much consideration. A quality satellite image mosaic needs to deal with that as well but usually this tends to be treated as a side effect within the bigger cloud related problems and people just try to handle this but don’t care much about how they handle this.
There are a number of strategies that are commonly used when specifically dealing with this matter. Most of them tend to select a certain state within the spectrum of appearances and target what i like to call a stable extreme in the earth surface appearance. Targeting the vegetation maximum is an obvious and widely used approach here. Stable extreme means that that (a) the appearance you target is an extreme state with regards to some kind of definable property and (b) that this state is stable to some extent, i.e. nature has some persistence in staying this way. The vegetation maximum in most parts of the earth qualifies as such a state. Another frequently targeted stable extreme, especially in regions with a distinct rain season, is the dry season because clouds are often less of a problem then. A less stable extreme would – at least in temperate climate – be the snow maximum. Snow cover in low land areas in central Europe tends to be fairly volatile.
The most difficult state to target are the unstable transient states. One of the most interesting examples for this are autumn colors. The difficulty of assembling image mosaics showing this kind of situation is that
- you essentially target a single point in a fairly rapid development.
- what you target is not easily quantifiable because the change in colors of the vegetation during autumn is a multidimensional effect, different species of plant change their colors at different times across different color ranges and depend on the local setting in this regard as well.
- how this happens and when exactly this happens often varies strongly from one year to the other and the variance in time is often not small compared to the duration of the whole process. In other words: when the leaves start to change their color in one year they might already be falling in another year.

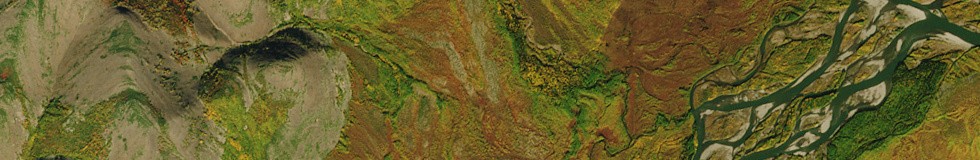
Because of these difficulties image mosaics of larger areas showing autumn colors are very rare. Trying to find out what can be done in that field i produced the following image of northeastern Russia showing the lower Lena River and the Verkhoyansk Range with autumn colors.

This by the way is the region on Earth with the most extreme temperature differences between winter and summer with a total range of naturally occurring temperatures of more than 100 degrees Celsius in some parts. It also is a region with extensive and quite diverse color changes of the vegetation in autumn – which is why i choose this area here.
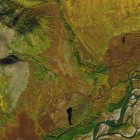
Compared to the usual image mosaics i produce creating such an image is not a well established and routine process yet. As you can see i did not create full coverage of the rectangular area and consistency as well as the level of cloud free-ness of the image are not quite on my usual levels. Due to the difficulties i described above many of the techniques i normally use for image assembly that help ensure the quality level do not work that well when i target an unstable transient state. None the less i think the results are pretty decent considering the difficulties. Here a few magnified crops:


Data basis is mostly Copernicus Sentinel-2 imagery supplemented with about 20-30 percent Landsat data.