This is part two of a four part series of blog posts on the depiction of trees in maps – see part one for a discussion of tree rendering in traditional maps and plans.
Tree mapping in OpenStreetMap
In OpenStreetMap trees are mapped with the tag natural=tree. This is among the ten most common tags in the OSM database with more than 18 million objects. It is also the third most commonly mapped singular feature type (after buildings and addresses – the other more common primary tags are road tags).
Consensus among mappers in OpenStreetMap is that ordinary trees in a forest/wood are not mapped individually. However, any other trees are (independent of any measure of notability – which would be hard to define in a verifiable form anyway) and mapping trees is popular among mappers, in particular in urban environments. Apart from individual trees there is also the concept of tree rows in OpenStreetMap – which essentially refers to trees planted in any way in a linear arrangement. Those are mapped with a way tagged natural=tree_row. There is no established tagging to indicate the spacing of trees in a tree row though. It is also generally accepted that trees are either to be mapped individually or in the form of a tree row object – but not both.
Bushes or shrubs are, on the other hand, so far only rather rarely mapped individually in OpenStreetMap. There is a clearly established tag for that (natural=shrub) – but with quite minimal use.
What is mapped again more frequently in OpenStreetMap is hedges – both in urban and in rural environments. Those are tagged with barrier=hedge on a linear way typically. There is also a practice to use this tag on polygons. However, due to the generally widespread habit of using barrier tags (barrier=wall, barrier=fence – and also barrier=hedge) as an add-on tag on polygons to indicate this polygon is enclosed by such a barrier, such use of barrier=hedge is inherently ambiguous and by many mappers nowadays not considered advisable tagging.
There are a number of secondary tags commonly added to more precisely characterize the tree/shrub/tree row or hedge:
denotation– this is an attempt to classify the role a tree has or for what purpose it was planted. In many cases, especially in case of the most common valueurban, this is a non-verifiable classification. Still some data users use it as an importance rating. It is tagged on about 9 percent of trees.leaf_type/leaf_cycle– these are the classic classification tags for trees as they are also applied for forests/woods (where i discussed the rendering previously). For individual trees/shrubs there obviously is nomixedtype but for tree rows and hedges there can be. The percentages for use onnatural=treeare:
tag percentage of trees tagged leaf_type=broadleaved15.5 leaf_type=needleleaved1.28 leaf_cycle=deciduous8 leaf_cycle=evergreen2.15 diameter_crown– this tag is used to map the approximate diameter of the crown of the tree, or if you’d want to do it precisely: The diameter of the area equivalent circle to the footprint of the tree crown. This is only tagged on trees. Shrubs, tree rows and hedges use the tagwidthinstead.width– this tag is used to indicate the cross section/width of the foliage of the plants in question on shrubs, tree rows and hedges.diameter– to indicate the diameter of the trunk of the tree.height– to indicate the overall height of the plant/plants including foliage.species/genus/family/taxon/...– a more precise taxonomical classification beyondleaf_type/leaf_cycleis tagged on quite a few trees. There are different tags used for that, their percentages of use onnatural=treeare:
tag percentage of trees tagged percentage with language tag only species6.8 – genus3.9 – species:de1 0.0038 taxon1 – species:en1 0.13 genus:en0.9 0.024 species:it0.54 0.0011 genus:it0.46 0.00036 genus:de0.36 0.007 species:ro0.35 0 taxon:species0.26 – species:es0.19 0.003 taxon:family0.17 – species:fr0.16 0.012 taxon:pt0.15 0 taxon:cultivar0.15 – genus:fr0.14 0.001 As can be seen, species is the most popular tag, genus and taxon are also popular but often used in addition to species. There are however also a significant number of cases (1.1 percent) where genus is tagged without species (which is understandable when mappers cannot precisely determine the species although they know the genus – in particular in cases where this is difficult like for example Pinus and Salix). The non-Latin tags with the language suffix are commonly used in addition to the main Latin tags – the percentage of trees with only the non-Latin tagging is indicated in the table – by far the highest percentage exists for
species:en.name– about 0.3 percent of all trees have a name tagged.
The overall usage of the four primary tags discussed as well as the percentage with various secondary tags can be found in the following table. The taxonomy column indicates how many of the features have any of the common Latin taxonomic tags applied.
| tag | uses | leaf_type | leaf_cycle | taxonomy | dc/width | height |
|---|---|---|---|---|---|---|
natural=tree |
18.8M | 17% | 10% | 8.4% | 1.3% | 4.1% |
natural=tree_row |
1.14M | 17% | 10% | 0.66% | 0.55% | <0.1% |
natural=shrub |
1020k | 2.7% | 2.5% | 9.5% | 4.4% | 1.9% |
barrier=hedge |
2.4M | 1.3% | 0.57% | 0.16% | 1.8% | 0.23% |
Tree rendering in OSM-Carto
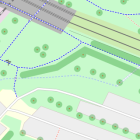
To say it right away – most maps based on OpenStreetMap data do not render trees. Apart from OSM-Carto and derivatives (almost all of them render trees in some form) there are just a few publicly available online maps that show trees – like Thunderforest Landscape and Geofabrik Topo. OSMAnd also includes trees in its mobile offline maps (with a profile symbol).
Trees in (from left to right): Thunderforest Landscape, Geofabrik Topo and OsmAnd
Notable tree rendering exists in Map Machine – which uses profile symbols and differentiates leaf_type and leaf_cycle as well as a few genera.
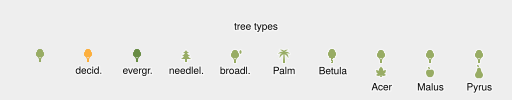
Map Machine rendering of trees
OSM-Carto has rendered trees since the beginning. Originally that was in the form of small green dots – which were based on a PNG image with a white background – therefore that looked a bit awkward on darker colors. In 2014 we adopted a new design for trees from the French OSM-Carto fork that shows a simple dot at z16 first and at higher zoom levels turns into a top view symbol of a tree.
This design uses transparency on the symbol to allow features underneath to be visible to some extent. The tree symbols are also unique as a point symbol in the style because they are non-blocking, i.e. they can overlap with each other and with other features or text. The transparency is implemented on the layer level instead of the feature level so overlapping trees are shown in a uniform, continuous coloring without the opacity of the individual trees accumulating. Tree rows are rendered in the same manner with a semitransparent line of constant width. There was discussion on changing that but nothing came out of that so far.

Current tree rendering on OSM-Carto with the handling of overlaps between features
In 2017, tree symbol rendering on z16 and z17 was removed but without adjusting either the zoom level progression or the label rendering of the tree name (which was introduced in 2014 as well). This led to the tree rendering becoming more like a static POI symbol which starts appearing suddenly at a certain zoom level (z18) and then remains more or less as this (just getting a bit larger at z19).
| z16 | z17 | z18 | z19 | |
|---|---|---|---|---|
| tree v1 |  |
 |
 |
 |
| tree v4.2.0 |  |
 |
 |
 |
| tree current |  |
 |
 |
 |
| tree_row current |  |
 |
 |
 |
| hedge current |  |
 |
 |
 |
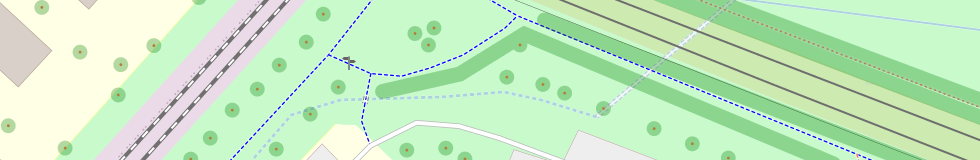
Apart from that the main problem with this design is the transparency. To make trees well visible on all kinds of backgrounds (both the bright map background color and the white fill color of roads as well as the dark green of forests) the color has to be fairly dark, moderated through the use of low opacity. But that also means that the color in rendering will be very different depending on the background – leading to a very non-uniform appearance of trees in different contexts. And it leads to weird and confusing color mixing with the colors below. The main idea – keeping the features below the tree symbol visible while still showing the tree in a symbol of reasonable size relative to the typical size of a tree canopy – is only poorly facilitated by this.
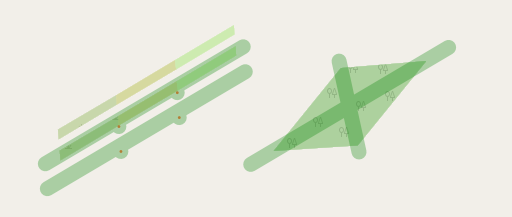
Problems resulting from the use of transparency in the OSM-Carto tree rendering
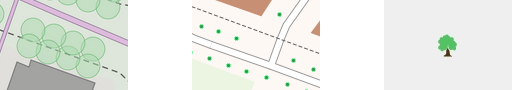
Also the color of trees and tree rows above the plain map background is close to the rendering color of wood/forest polygons. This makes them prone to be mistaken as a mapped polygon geometry – especially since small grained mapping of individual tree canopies or narrow strips of trees with wood polygons is not uncommon in OpenStreetMap.
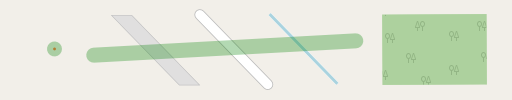
Tree and tree rows in comparison to wood/forest polygon fill
The third part of this series of blog post will show and explain a new concept for rendering trees, tree rows, shrubs and hedges that i have developed recently.
Pingback: weeklyOSM 619 | weekly – semanario – hebdo – 週刊 – týdeník – Wochennotiz – 주간 – tygodnik