Back in July 2017 when the first Sentinel-3 Level-2 data was released i did not write a detailed report like i did for the Level-1 data because i wanted to wait for the rest of the products – which are significantly more interesting at least for land areas – to give a more complete picture and allow for an overall assessment. It took more than another year for this to happen a few days ago – with a total time from satellite launch to the full data release of nearly 32 months or more than 1/3 of the satellite lifetime.
Here is the updated timeline for Sentinel data product publications:
- Sentinel-1A: Launch 3 Apr 2014, public data access since 9 May 2014 (1 month)
- Sentinel-2A: Launch 23 Jun 2015, access since end November 2015 (5 months)
- Sentinel-1B: Launch 25 Apr 2016, access since 26 Sep 2016 (5 months)
- Sentinel-3A: Launch 16 Feb 2016:
- OLCI L1 access since 20 Oct 2016 (8 months)
- SLSTR L1 access since 18 Nov 2016 (9 months)
- OLCI/SLSTR L2 access since 5/6 Jul 2017 (>16 months)
- SYNERGY L2 access since 10 Oct 2018 (nearly 32 months)
- OLCI L1/L2 from before 20 Oct 2016: Available since Sep 2018.
- SLSTR L1/L2 from before Nov 2016/Sep 2017: 32 months and counting.
- SYNERGY L2 from before 10 Oct 2018: missing and unclear if it will ever be available.
- Sentinel-3B: Launch 25 Apr 2018, 6 months and counting, unclear to what extent data is already recorded.
- Sentinel-2B: Launch 7 Mar 2017, access since end 5 Jul 2017 (4 months)
None the less here a quick introduction into this newly available data. You should probably read what i wrote on the Level-1 data first (part 1, part 2 and part 3) – much of which applies in analogy to the Level-2 data as well.
Data access
Data access to the land products works essentially as already described for the Level 1 data. Currently this still works through a separate provisional download portal which requires no registration but it will likely move to the general Sentinel data hub where registration is required.
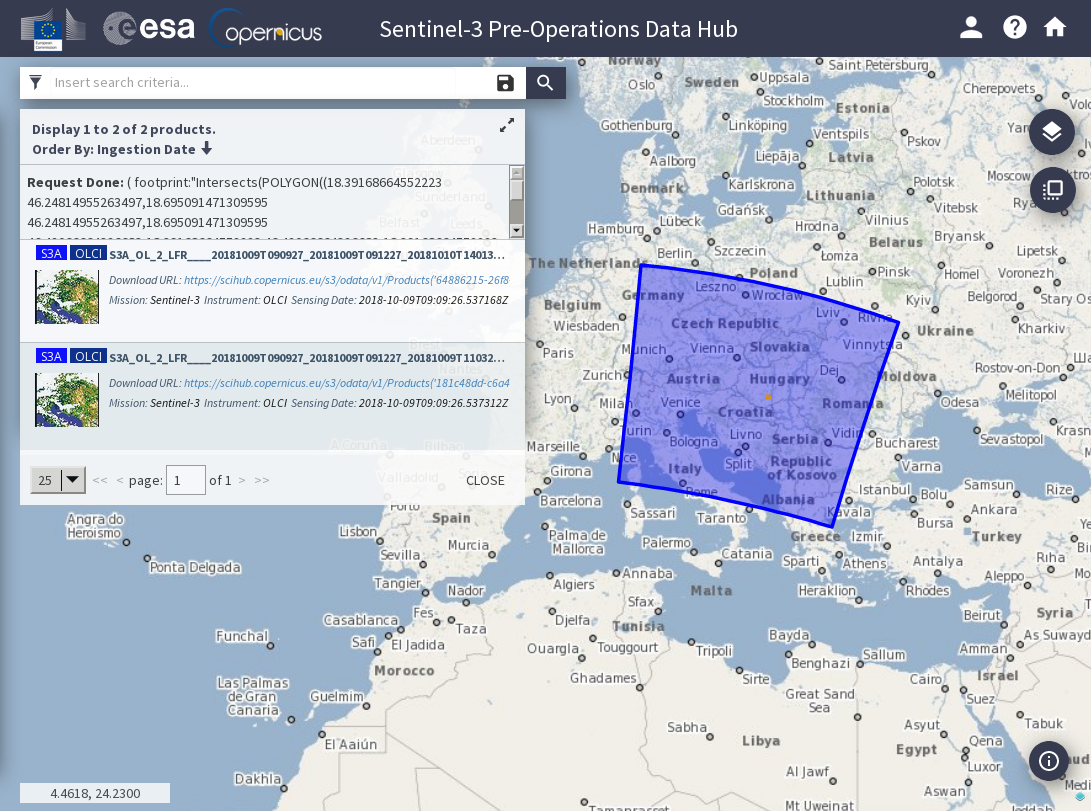
Sentinel-3 ESA data access hub
The water data products are however not available through the ESA infrastructure – they can be accessed through EUMETSAT. They use the same download software but in an older version with various flaws. As you can see the package footprint display is broken and you can also apparently not specify a spatial search area.
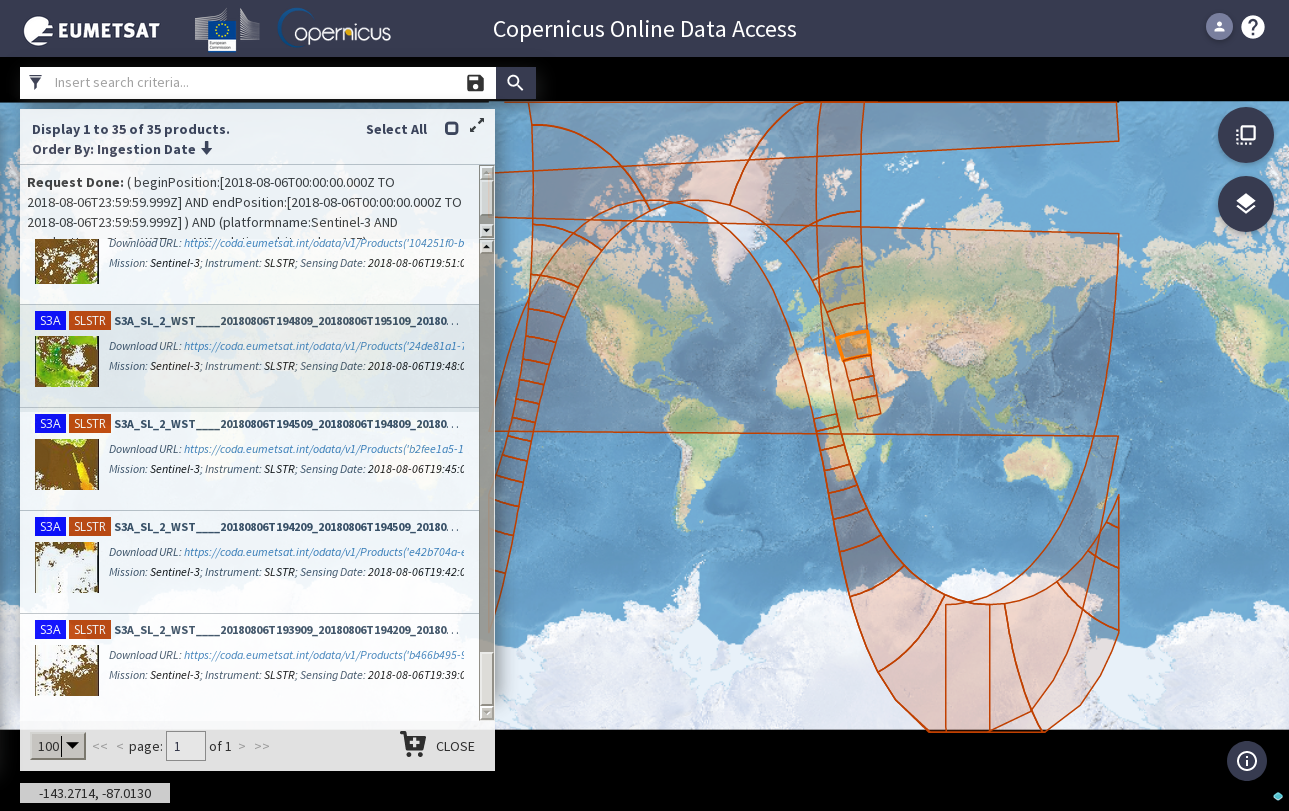
EUMETSAT Sentinel-3 data access
For the new synergy data products there are no preview images available at the moment and the previews of the other Level 2 products are in parts of rather limited use.
Both the ESA and the EUMETSAT interface can be scripted so you don’t have to use the UI.
Available data products
Here is the full table of now publicly available data Sentinel-3A data products. The first three products are the ones i already discussed. The last four are the newly released ones. These are so called SYNERGY products which combine both OLCI and SLSTR data.
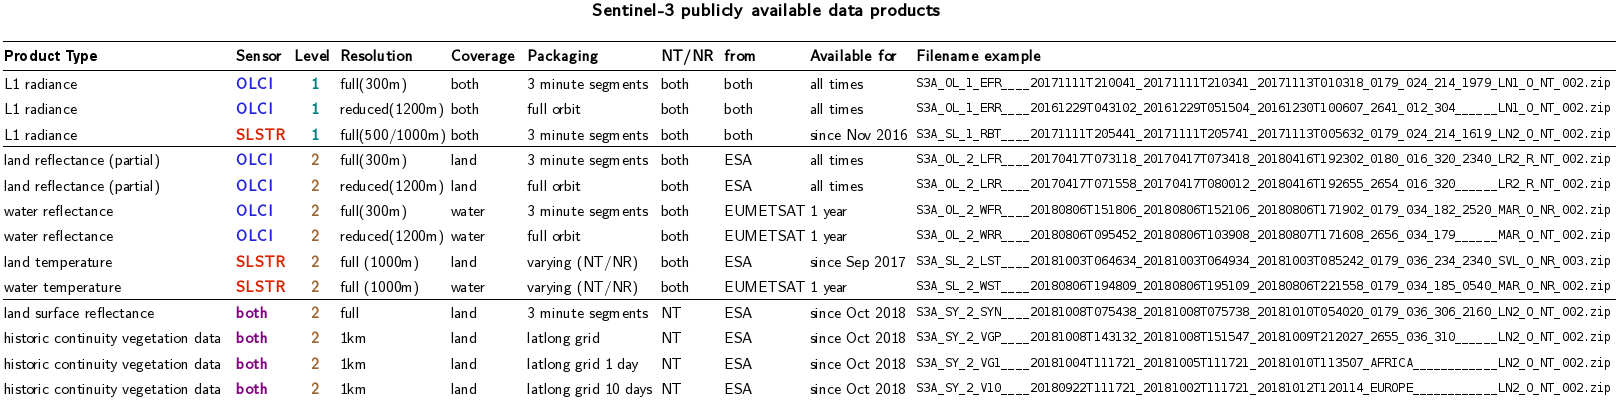
Sentinel-3 data product table
The whole thing is complicated not only because of the two separate sensors but also because in addition you have separate products for land and water. This idea is something they apparently copied from how MODIS data products have been planned with separate data centers being responsible for different fields of application and the corresponding products. But they really messed this up because while MODIS land products include inland waterbodies and near coastal and polar region water areas the Sentinel-3 land products just flatly leave out anything not strictly land and the water products leave out anything not strictly water. That leaves out in particular clouds as well as sea ice in both land and water products. Needless to say what is land and what is water is obviously not actually a very reliable definition.
The whole idea of tightly masking any kind of area not considered applicable for the processing in question is pretty bad. The sensible thing to do is to flag these areas as such in a separate quality data set but to process them none the less. This way you leave the decision how to use the data open for the user. Such an approach is also established practice in higher level image data products elsewhere. Masking the data instead with an arbitrary and low quality mask imposes mandatory mediocrity onto all data users.
This whole product design concept communicates a highly questionable, arrogant and narrow minded culture and attitude that in many ways sharply contrasts with the basic ideas of the Sentinel program. While openly making available this data is supposed to enable and support new innovative applications those people who designed these products quite clearly think they know better than any of the potential data users how the data can be used.
There is no sensible reason to not include inland waterbodies and coastal and sea ice covered waters in the land data products, this does not even reduce the data volume in a meaningful way. The very idea that an image pixel can only be either water or land is in itself pretty absurd.
This to keep in mind when looking at the available data products – most of the land products have pixels decreed to be non-land zeroed out and the water products have the non-water pixels zeroed out. Some data in addition has cloud masking applied. There are a few exceptions from this division though showing that this is not really a technical limitation but an arbitrary choice made.
OLCI land surface reflectance products (LFR/LRR)
The first data product i am going to discuss is the Level 2 OLCI land product which is available in the full and the reduced resolution variant. Like the Level 1 products the full resolution data is distributed in 3 minute sections of the recordings along the orbital path while the reduced resolution data is packaged for a whole dayside part of the orbit based on the fairly narrow sun angle recording limits of the OLCI instrument. In the original product grid this means a size of usually 4865×4091 pixel for the full resolution data and about 1217×15000 pixel for a half orbit. Package sizes for the full resolution version vary quite strongly due to the nodata masking (see below) between less than 100MB to about 200MB. The reduced resolution packages are usually around 200MB in size.
The land surface reflectance product is actually not what the product description seems to promise because it contains reflectance values only for two of the OLCI spectral channels (Oa10 and Oa17, that is red and NIR) plus a few aggregated values calculated from these and other spectral channels. Here is a visualization of them:
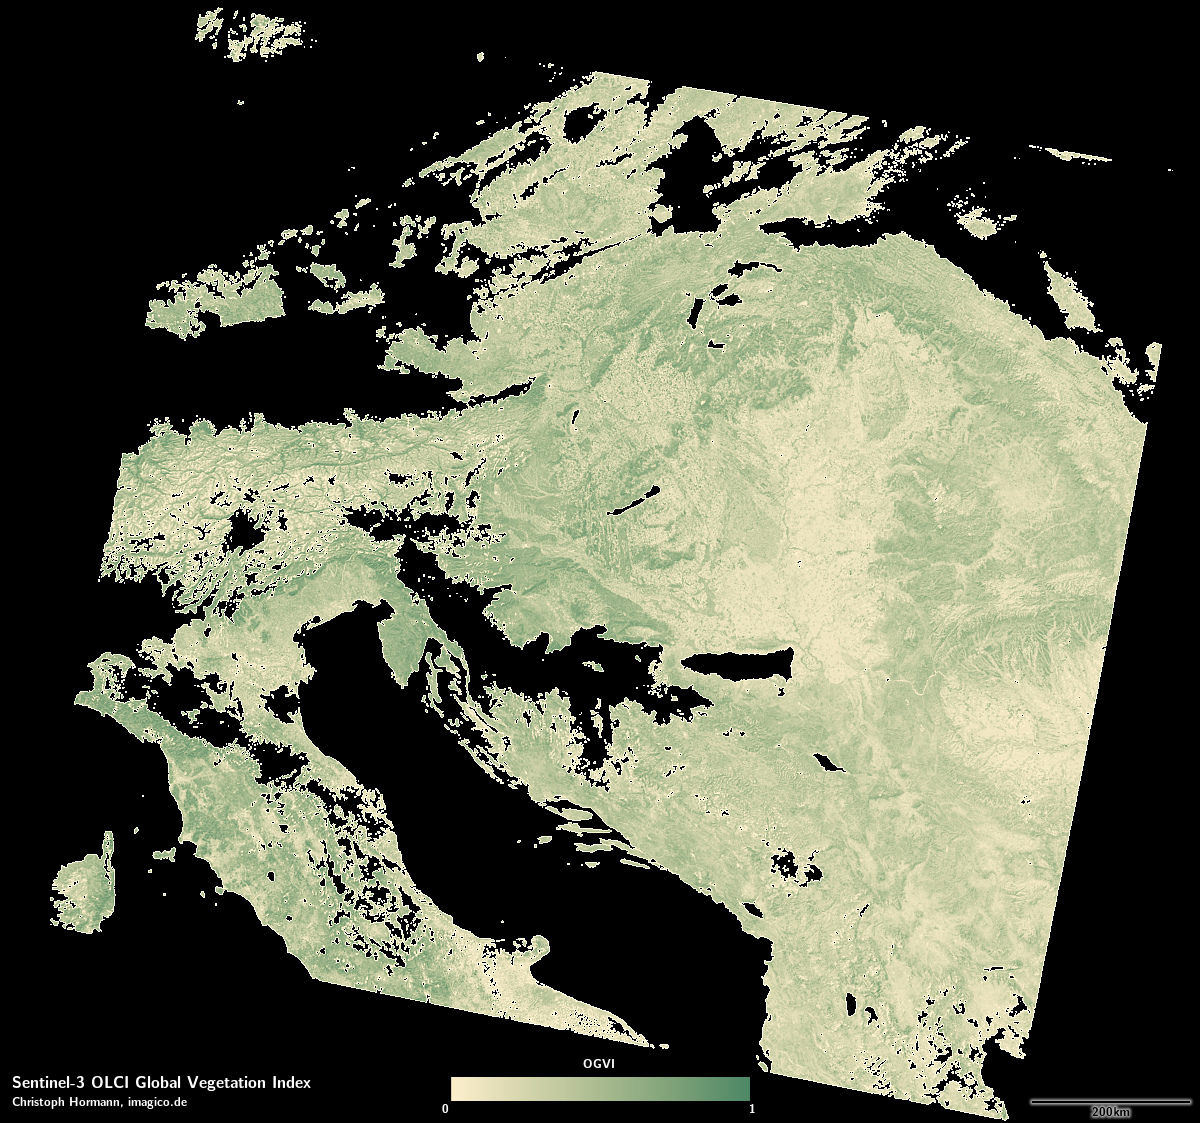
OLCI L2 OGVI example
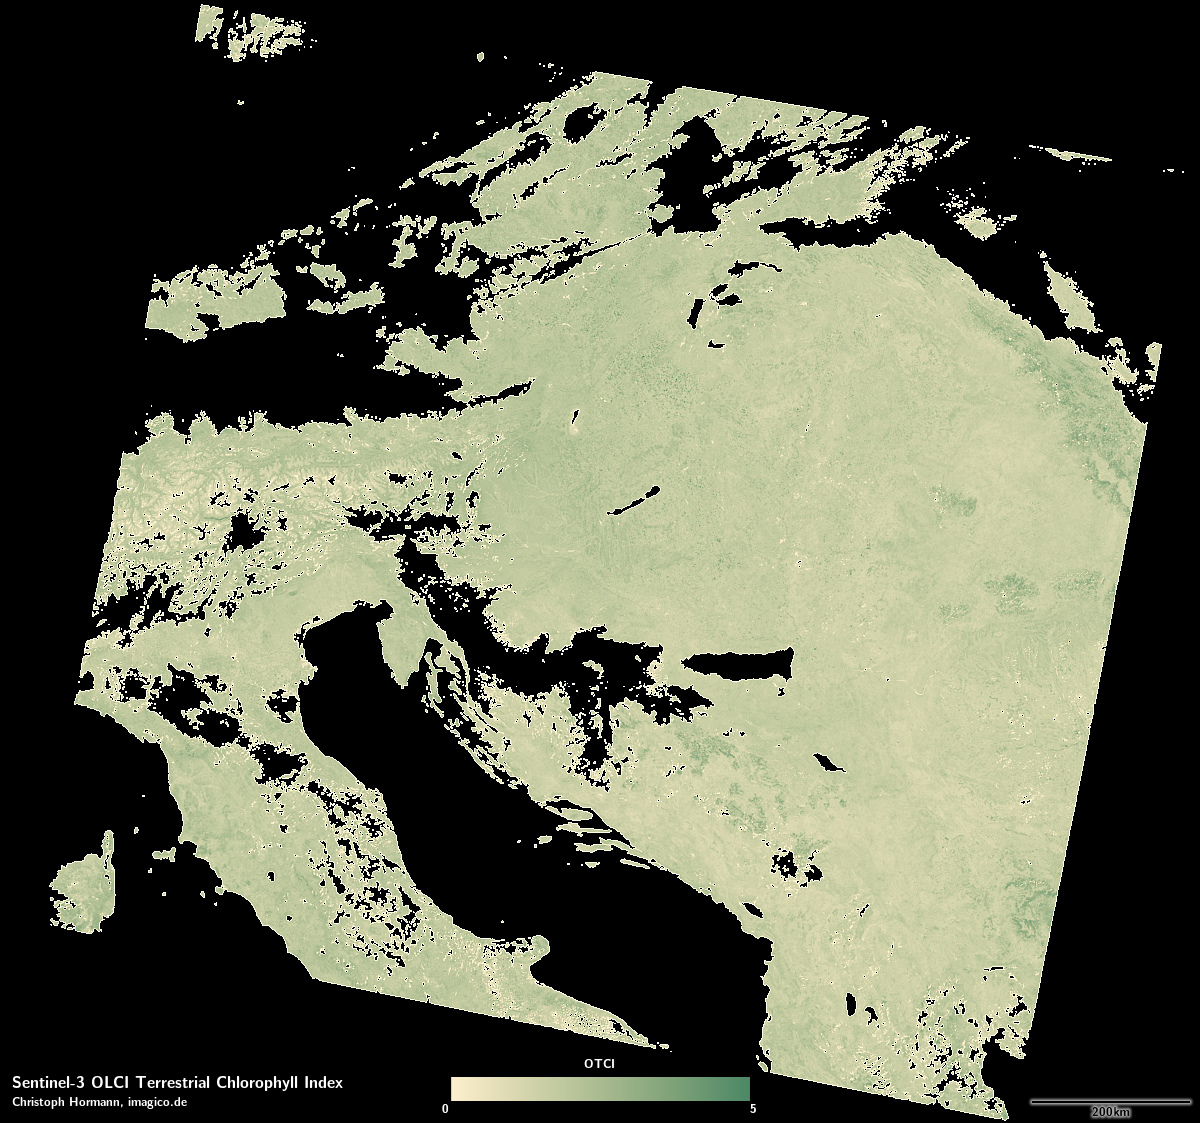
OLCI L2 OTCI example
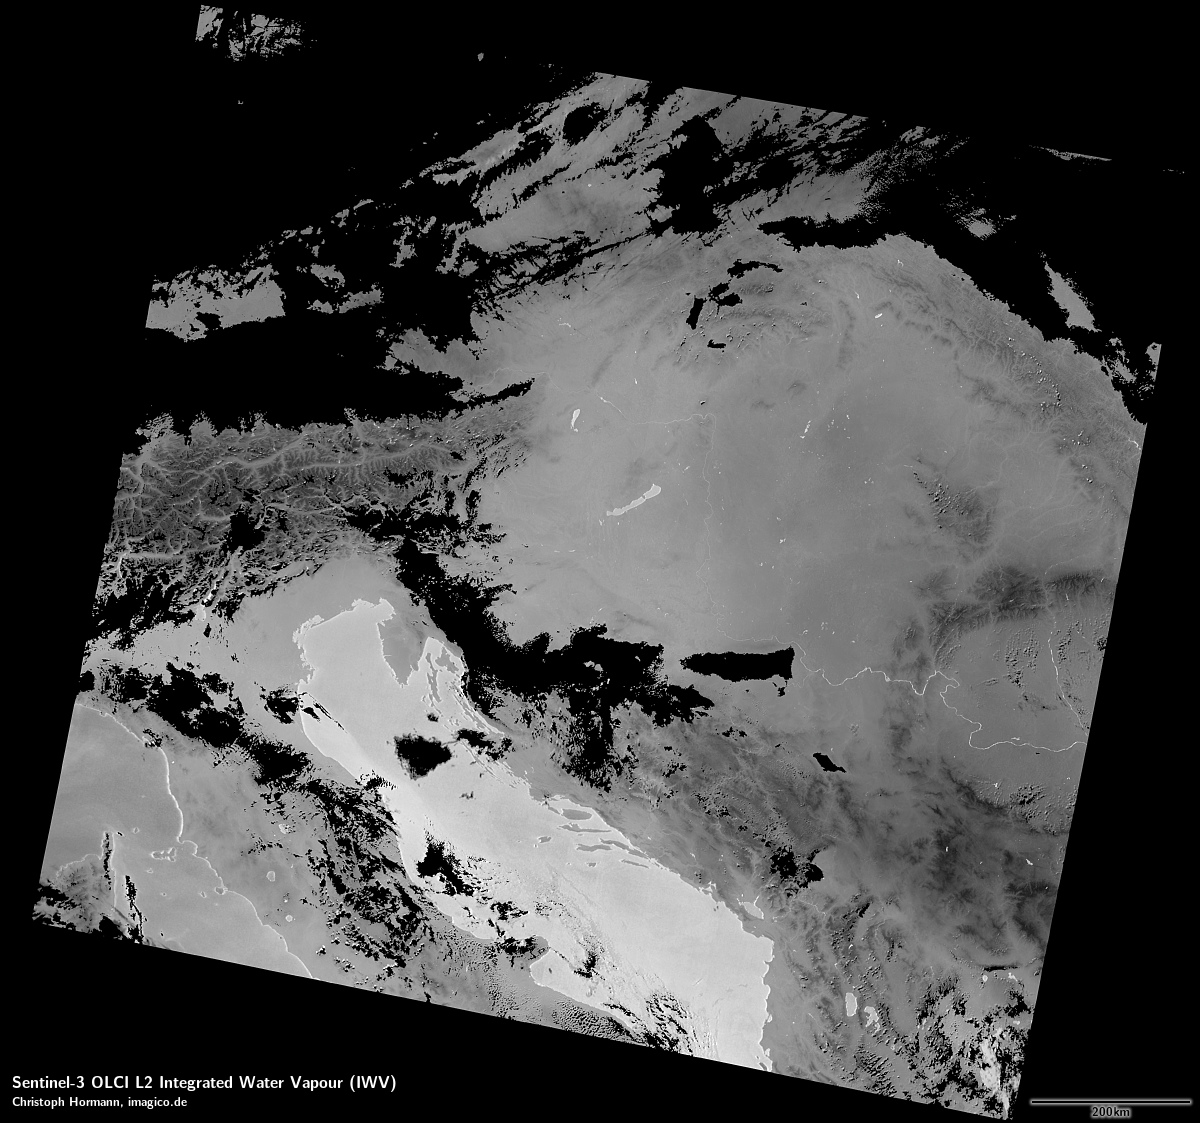
OLCI L2 IWV example
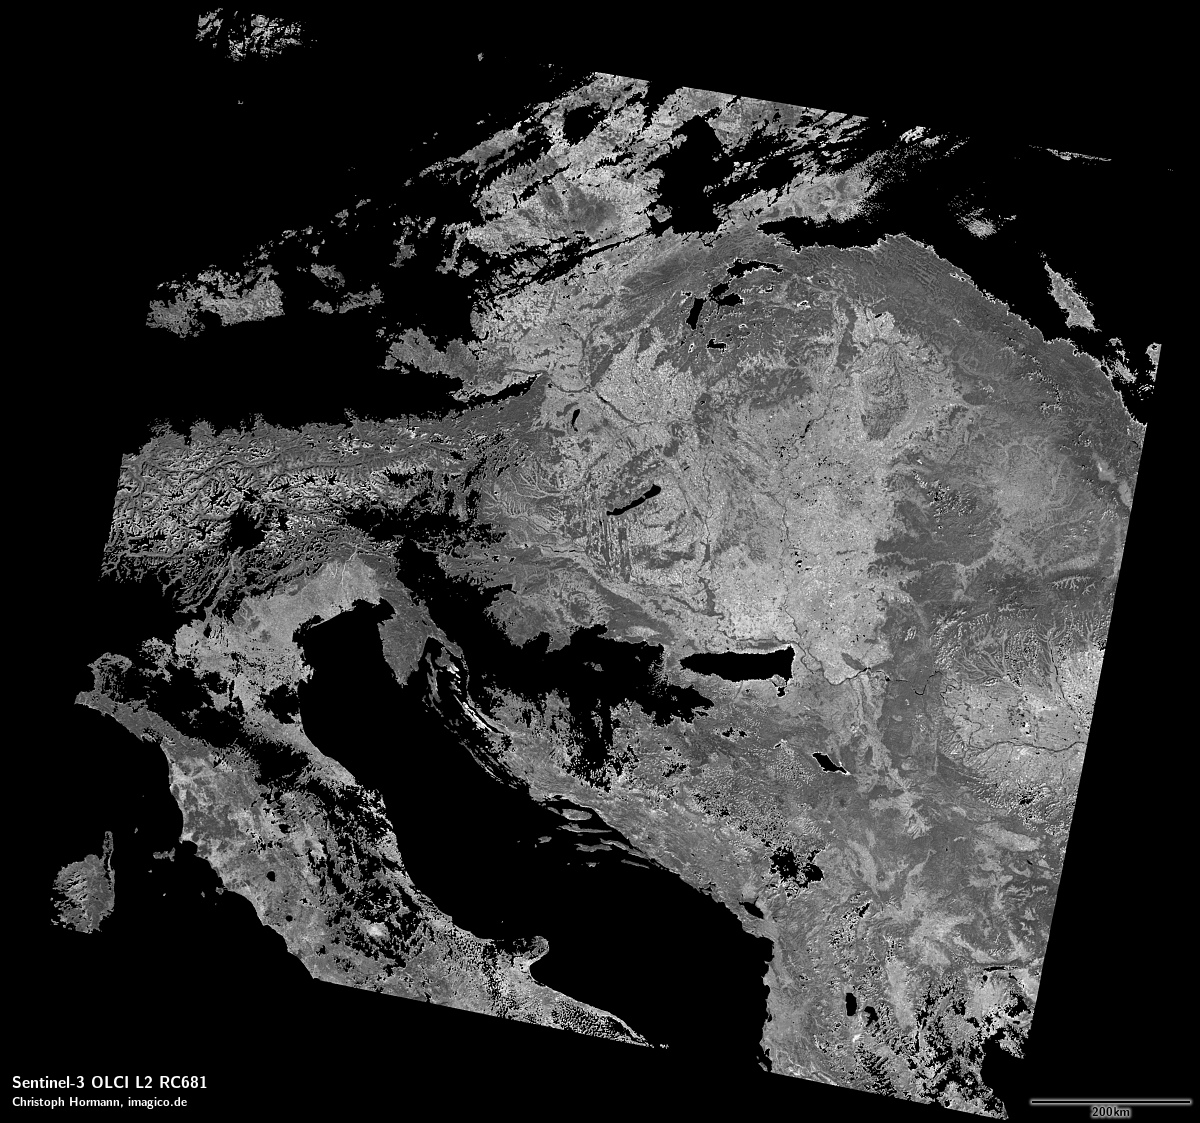
OLCI L2 RC681 example
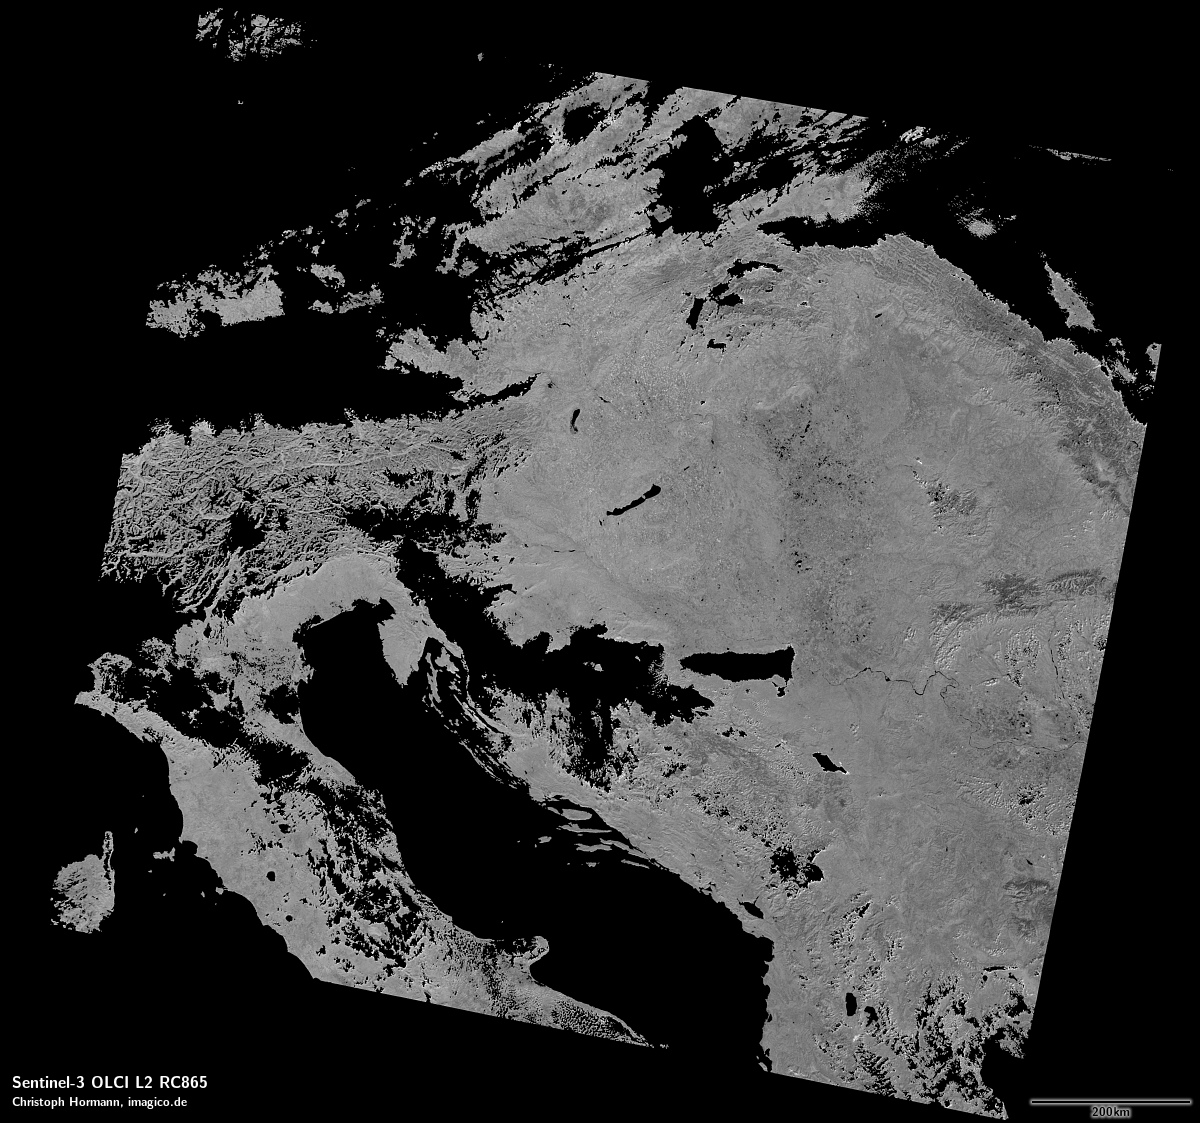
OLCI L2 RC865 example
As you can see both water areas and clouds are masked – except for the water vapor data where the water is not masked. In addition also sea ice and snow/land ice are not included.

Northern Greenland RC681 showing both land and sea ice are masked
So this data product is kind of a cheat – in fact it is a really strange combination of some vegetation and reflectance data (for vegetated land areas only) and atmosphere related data for land and water thrown together. As a specialized vegetation data product it can be pretty useful but as the only OLCI Level 2 data product it is a complete failure. I mean you have the OLCI instrument with 21 spectral channels and the only data above the raw Level 1 radiances you can get is this. So far the only real land surface reflectance data you can get is in the synergy products (see below) – which has its own limitations.
The water masking at least seems to be based on actual water classification and not from an arbitrary and inaccurate pre-defined land water mask as in the temperature and synergy products.
OLCI water surface reflectance products (WFR/WRR)
As a water product this is – as mentioned – only available from the EUMETSAT download infrastructure and is only provided for one year after recording there.
In contrast to the OLCI land surface reflectance products the water surface reflectance product is fairly solid and complete. It contains atmosphere and view direction compensated water surface reflectances for all the OLCI spectral channels. Packaging and grid sizes are the same as with the other OLCI products and like the land products packages size for the full resolution packages varies with up to 500-600MB while the reduced resolution packages are about 300-400MB typically.
Here an example for a visual color rendering from a full resolution package.
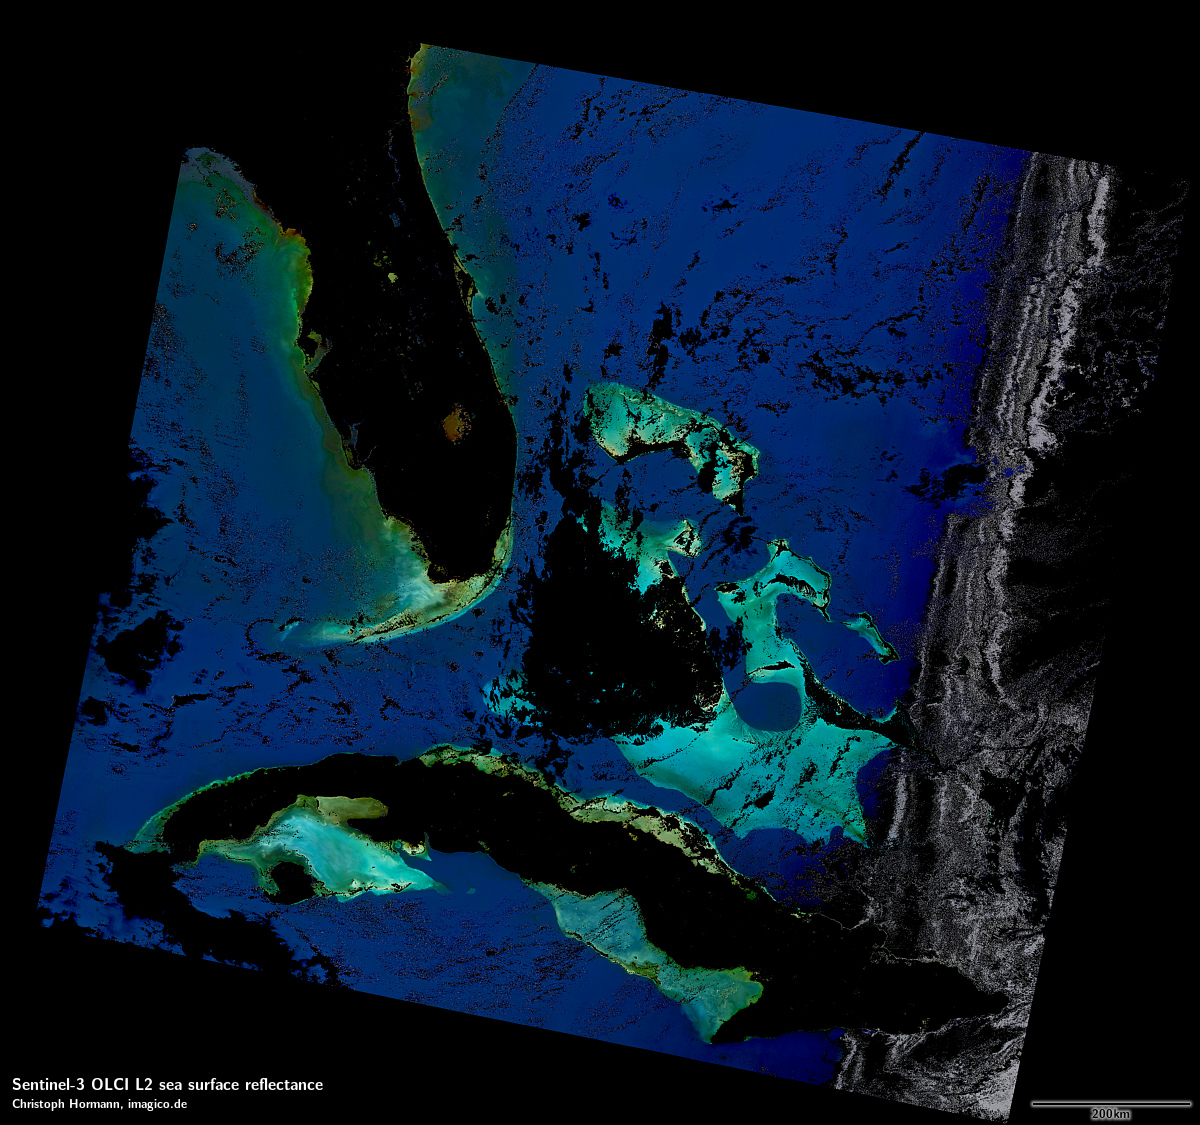
OLCI water surface reflectance in the visible spectrum
As you can see not only the land is masked but also clouds and sun glint on the right side. This is not very reliable but rather a fairly conservative masking. And as indicated in the introduction sea ice is not included either.

OLCI water surface reflectance with sea ice masked
Quality of the data processing seems pretty decent. There are some problems with thin clouds and their shadows and the results degrade a bit towards the sun glint areas but overall this is quite competitive in quality.
Land surface temperature products (LST)
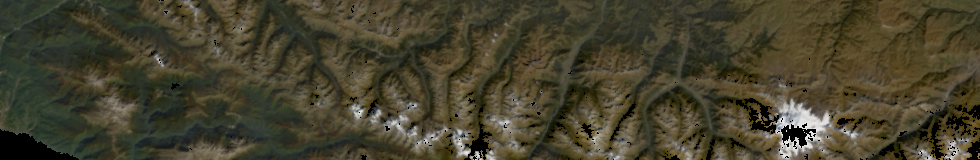
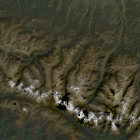
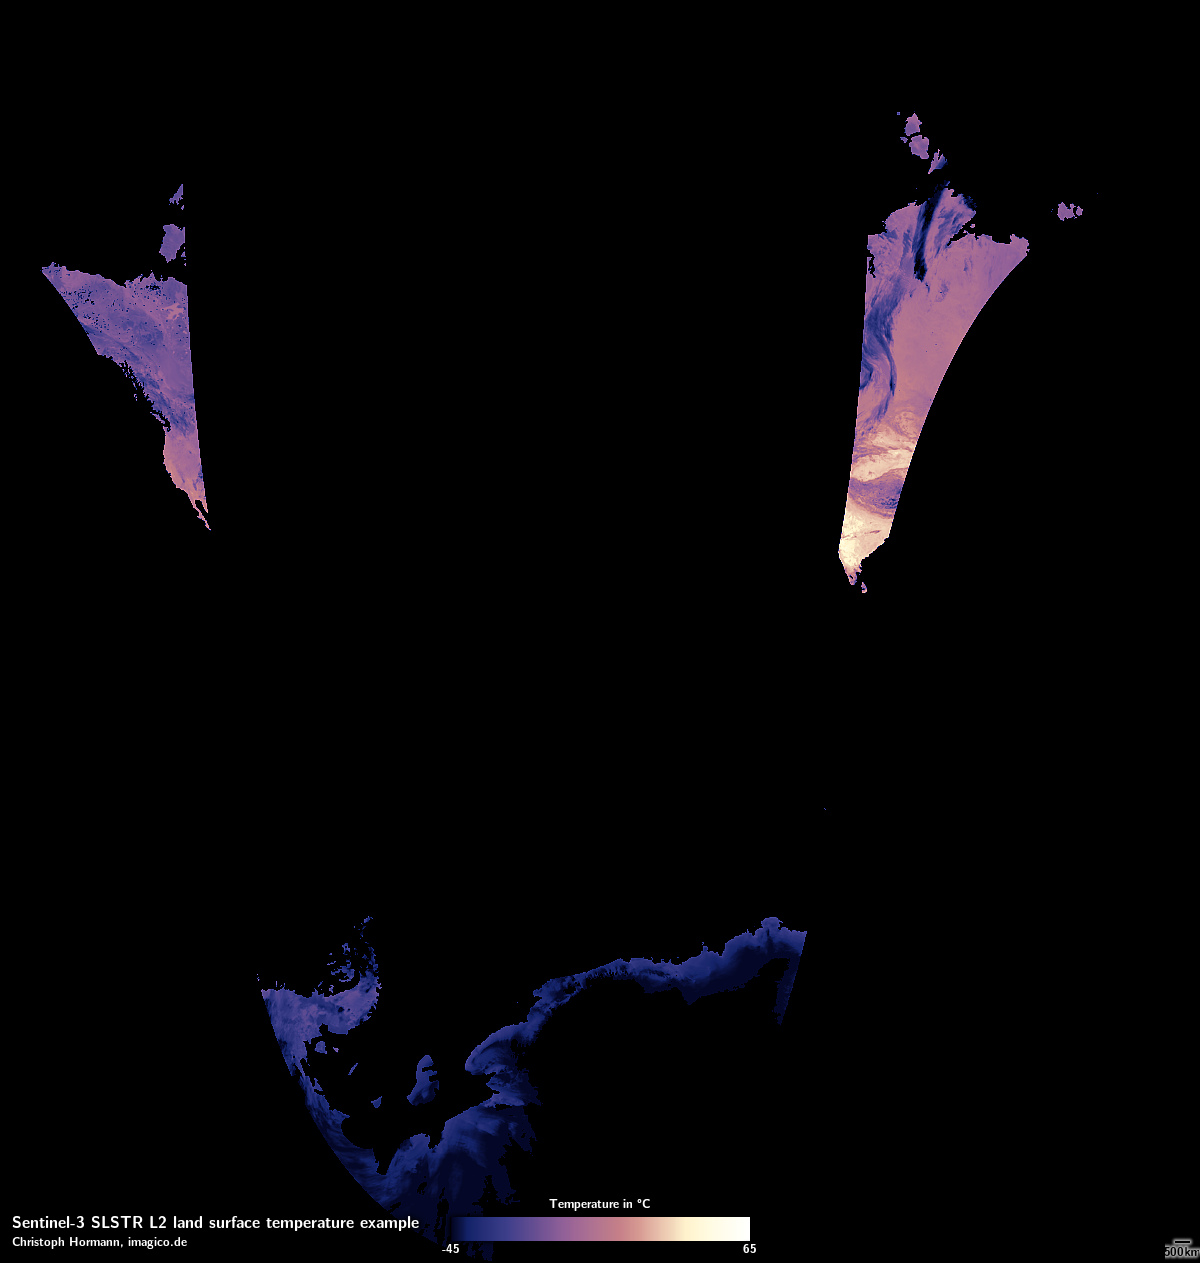
This SLSTR based product contains an estimate of the land surface temperature based on the thermal infrared recordings and as such is available both for the day and night side of the orbit. As a land product it is only available from the ESA download infrastructure. The Level 1 thermal infrared data is already quantified in temperature units (Kelvin) but it is the raw, unprocessed data. I showed illustrations based on the Level 1 data previously. Here an example for comparison how this differs from the Level 2 data – with both the land and water versions for comparison, in an Antarctic setting with very little open water at this time of year.
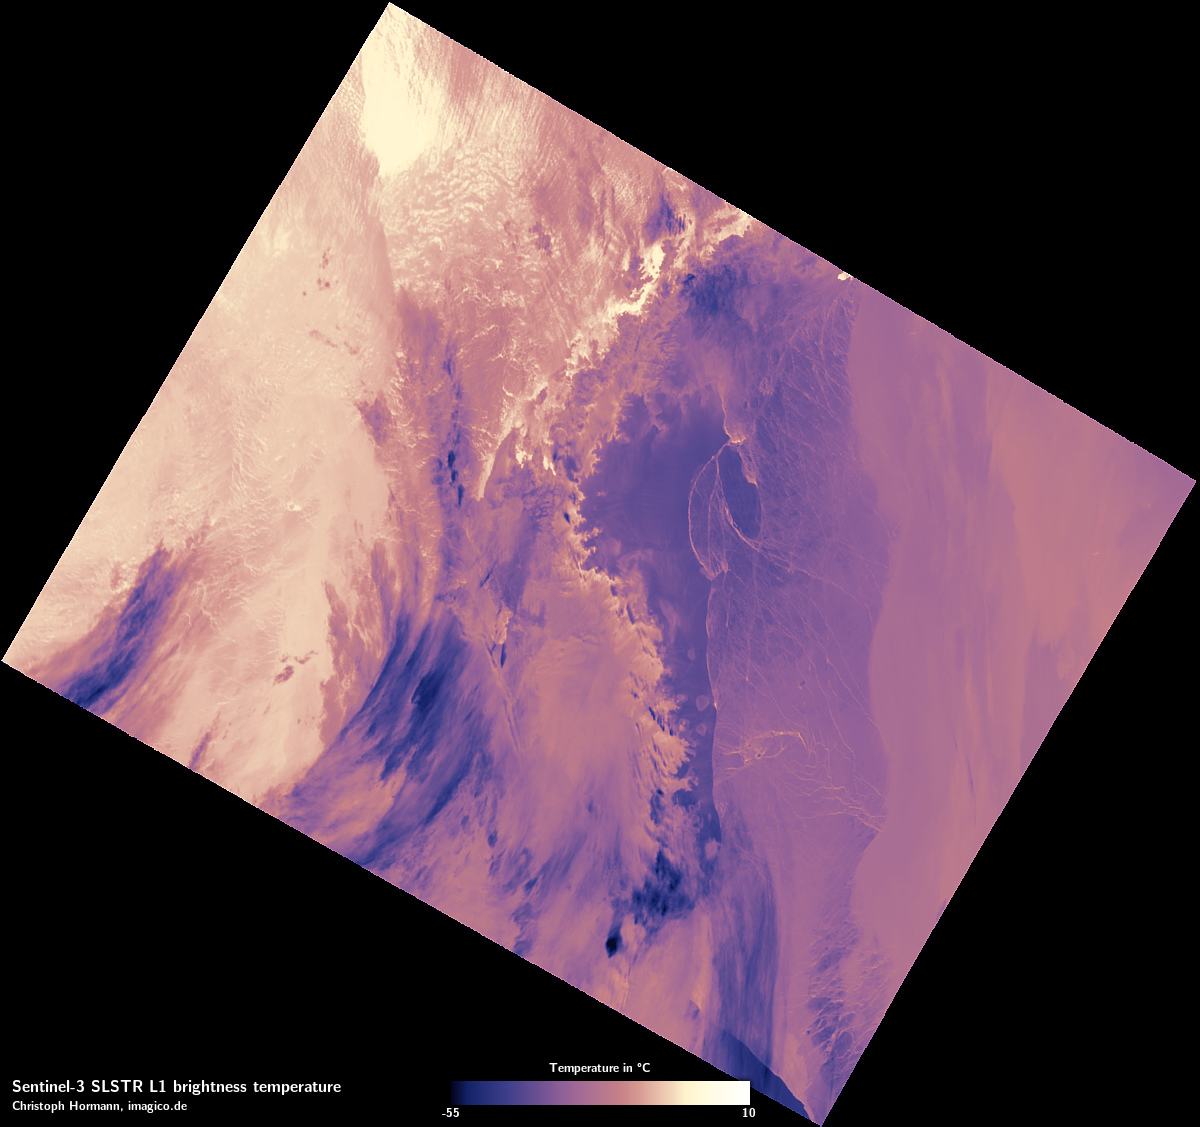
SLSTR L1 S8 brightness temperature
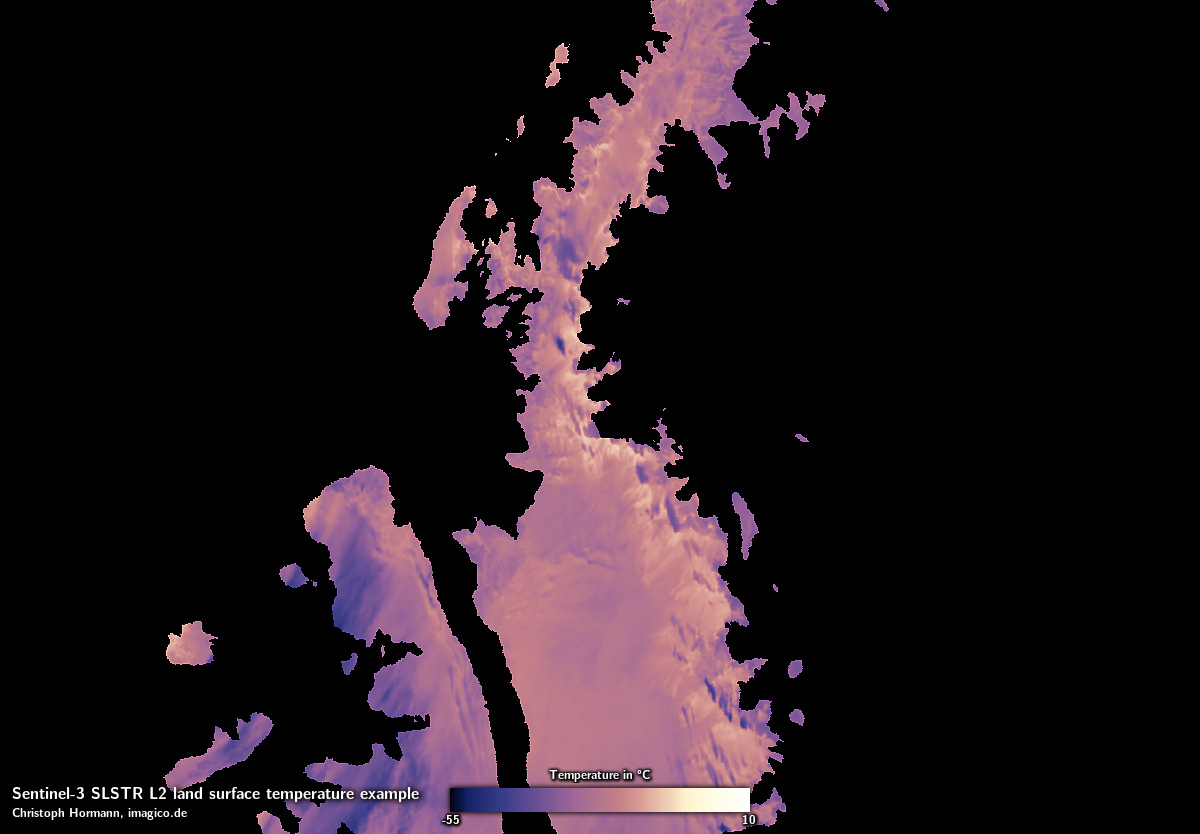
SLSTR L2 land surface temperature

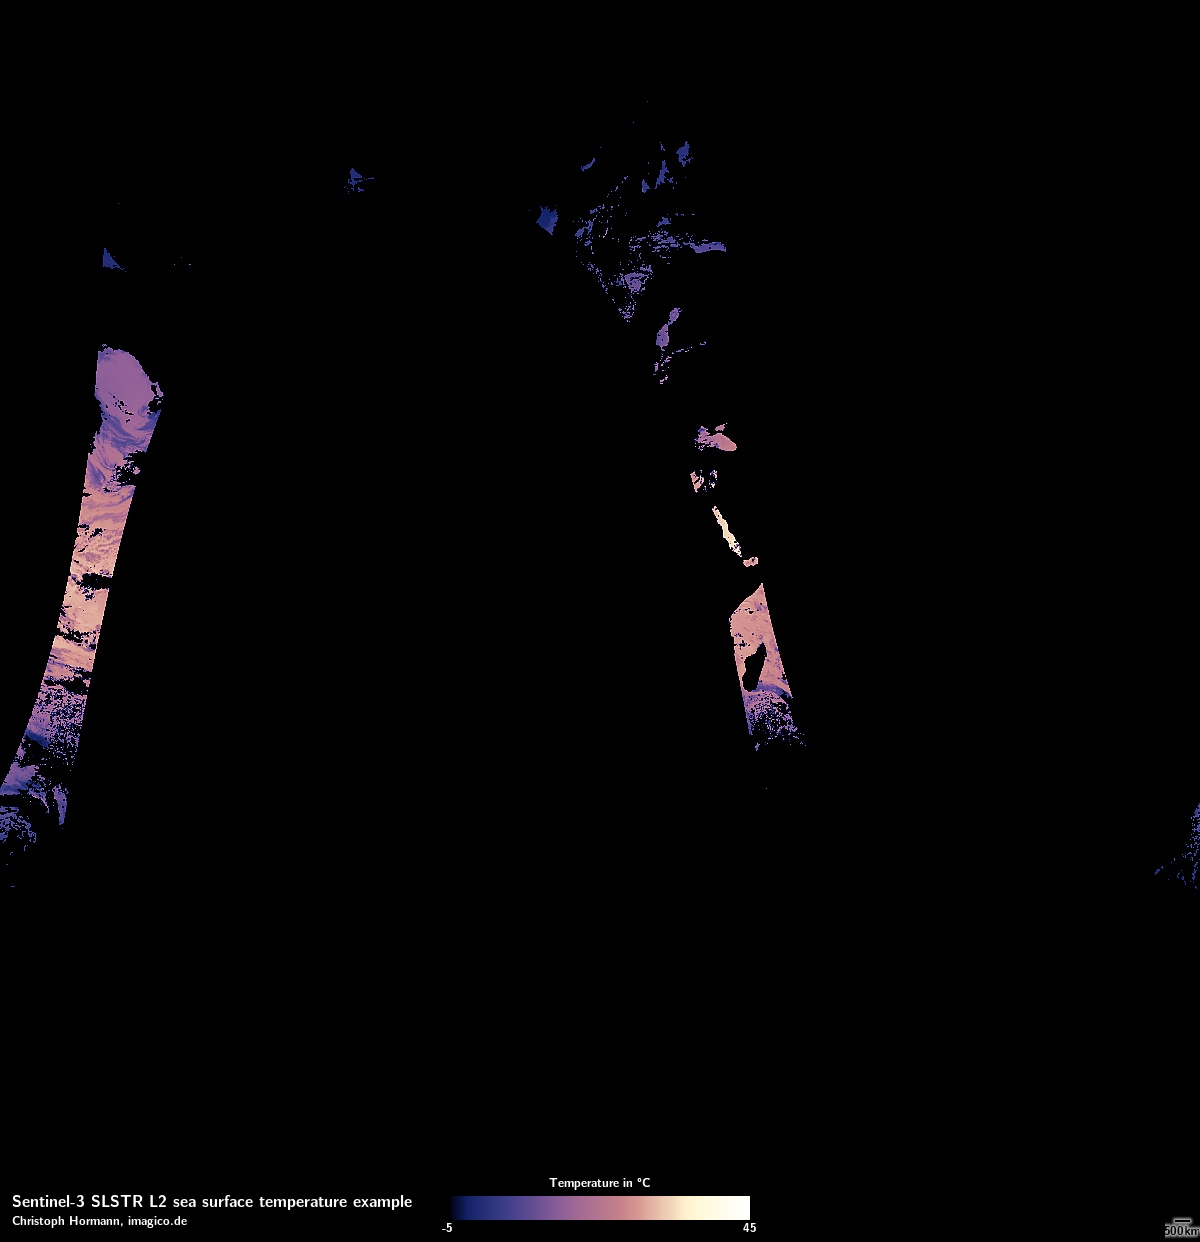
SLSTR L2 sea surface temperature
The Level 2 land surface temperature data is made available in a form quite similar to the Level 1 data with separate files for the geolocation data and other supplementary information. One particularity of the Level 2 temperature data (both land and water) is that the near real time version is provided in the 3 minute orbit segment tiling like the Level 1 data while the not time critical data is made available for the whole orbit in one package. In the coordinate system that is a long strip of data about 1500×40394 pixels which wraps once around the globe. A 3 minute packages is typically about 60-70MB in size, a full orbit package about 1.8GB.

near real time land surface temperature package
not time critical land surface temperature package
As you can see the land masking is not based on some actual land/water detection but from a fixed ocean mask. And apart from the already mentioned sea ice this mask excludes the Antarctic ice shelves – so if you happen to be interested in temperatures there you are out of luck. And to demonstrate that the world does not implode when you calculate land surface temperatures on a water area – inland waterbodies including the Caspian Sea are included.
No cloud masking seems to be performed in this data product but there seems to be no data generated for very cold areas of the Antarctic interior as well as very hot areas above 345K (visible in the Iran image above).
Sea surface temperature products (WST)
This is in principle more or less the water version of the previous product but practically it is very different in a number of ways.
In contrast to the other data products all data is in one file – which is none the less zipped into the usual package. The geolocation data and other supplemental information is all in that file. This is not a big deal but the question is of course why this is inconsistent with the other products.
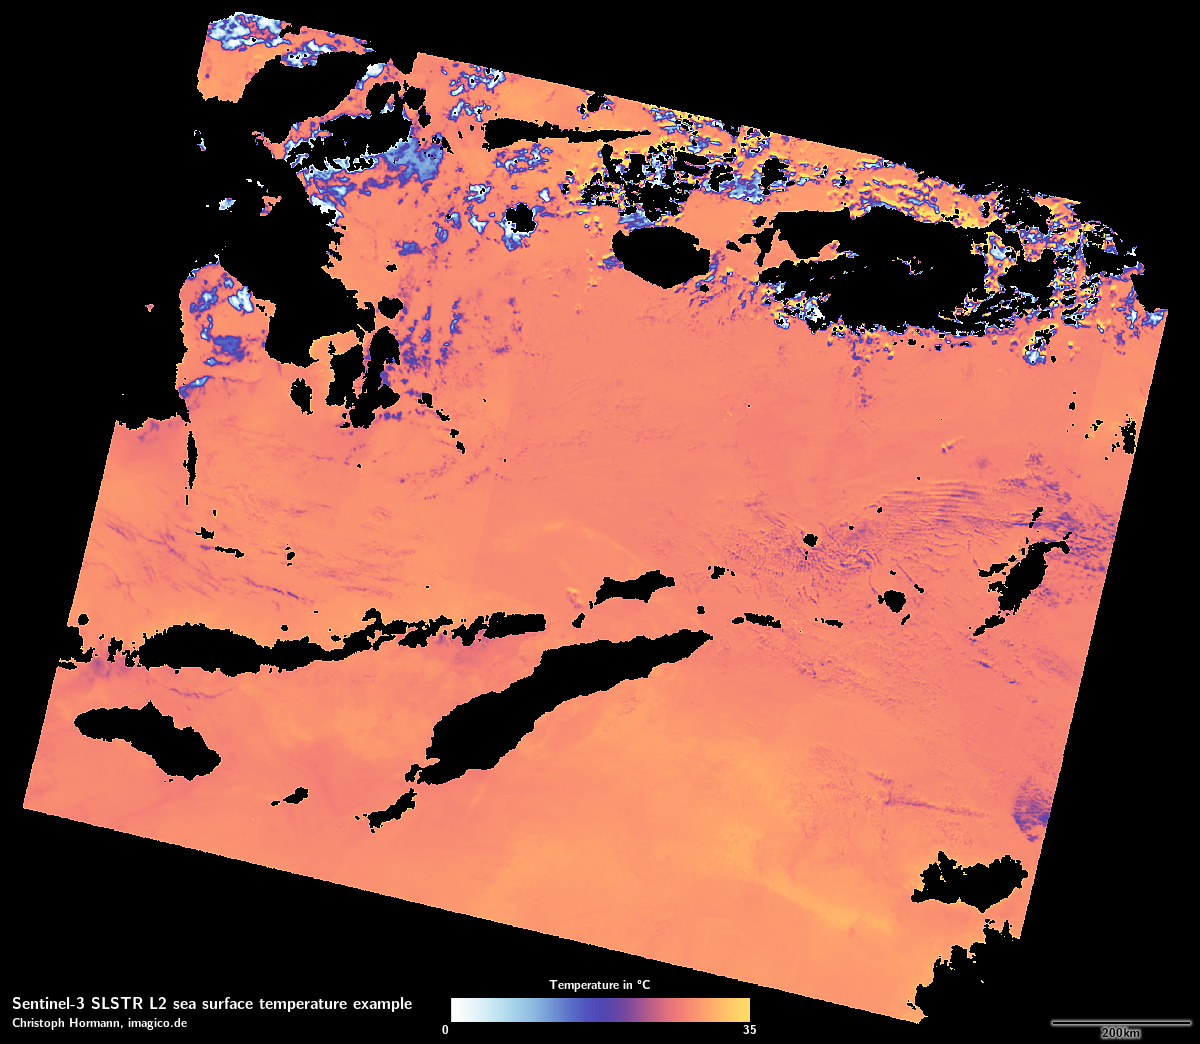
sea surface temperature with clouds masked in Indonesia
Also clouds are generally masked in the sea surface temperature data – though relatively sparsely. And as already indicated sea ice is not included either – though this does not seem to be masked based on actual sea ice detection in the data but from some unknown external data source.
Like with the land temperature data the near real time version comes in orbit segment tiling while the not time critical data is in whole orbit packages. Package size is on average smaller than for land data with about 20MB for a typical 3 minute package and about 600MB for a full orbit package.
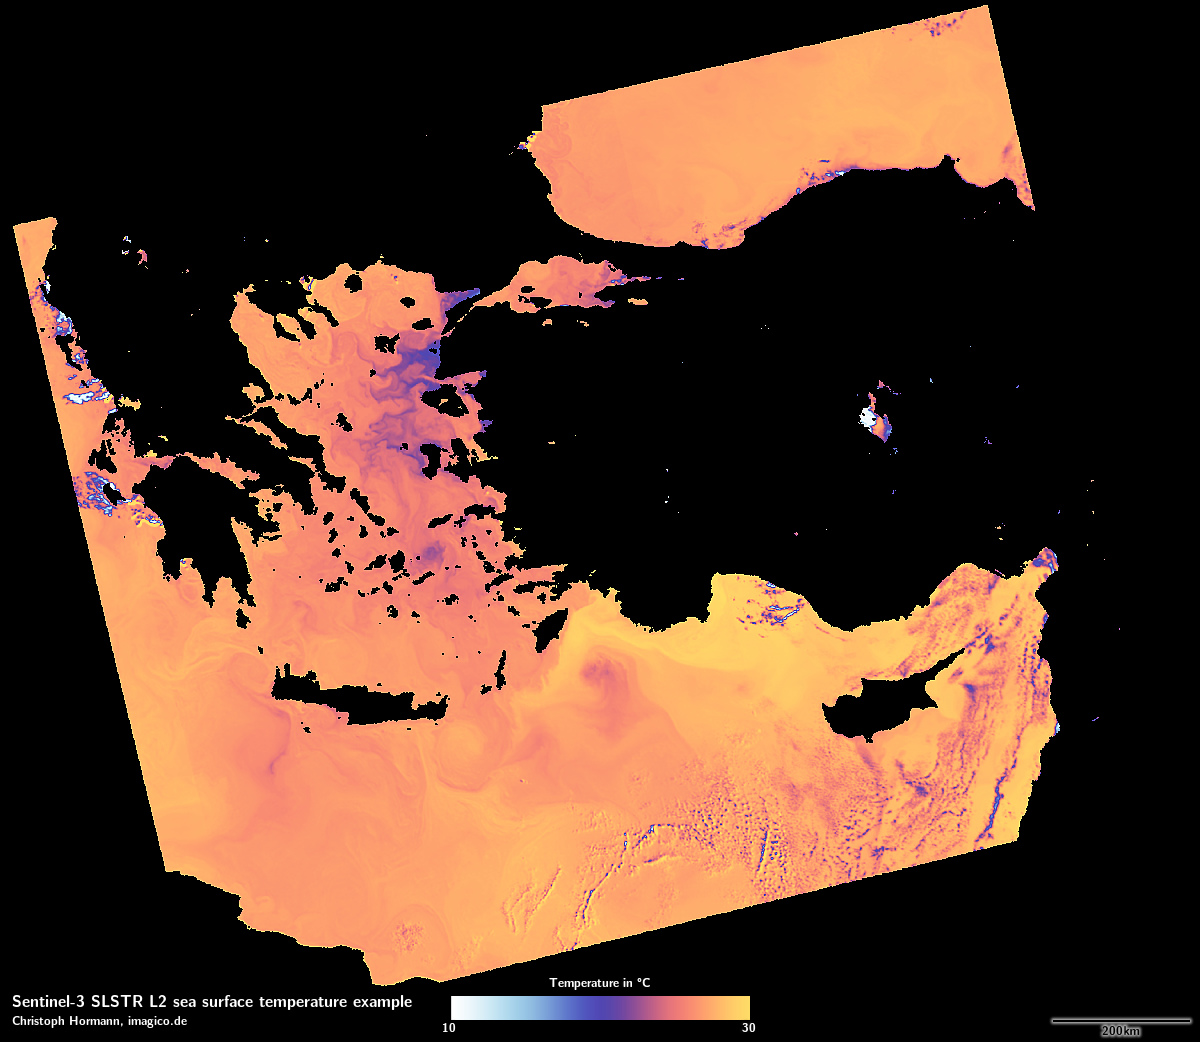
near real time sea surface temperature package from the eastern Mediterranean
not time critical sea surface temperature package
Combined land surface reflectance products (SYN)
So far the products described were those already released in 2017. The now newly released products are so called synergy products combining the SLSTR and OLCI data. The land surface reflectance synergy product is the only Level 2 data product for land containing most of the spectral channels so it is in a way the main Level 2 land data product. This is distributed in the normal 3 minute orbit sections with data from both the OLCI and the SLSTR reflective spectral channels being provided in the OLCI 300m grid (that is usually 4865×4091 pixel). These packages vary strongly in size between about 200MB and 1GB. Here how this looks like in the visible light spectral channels.
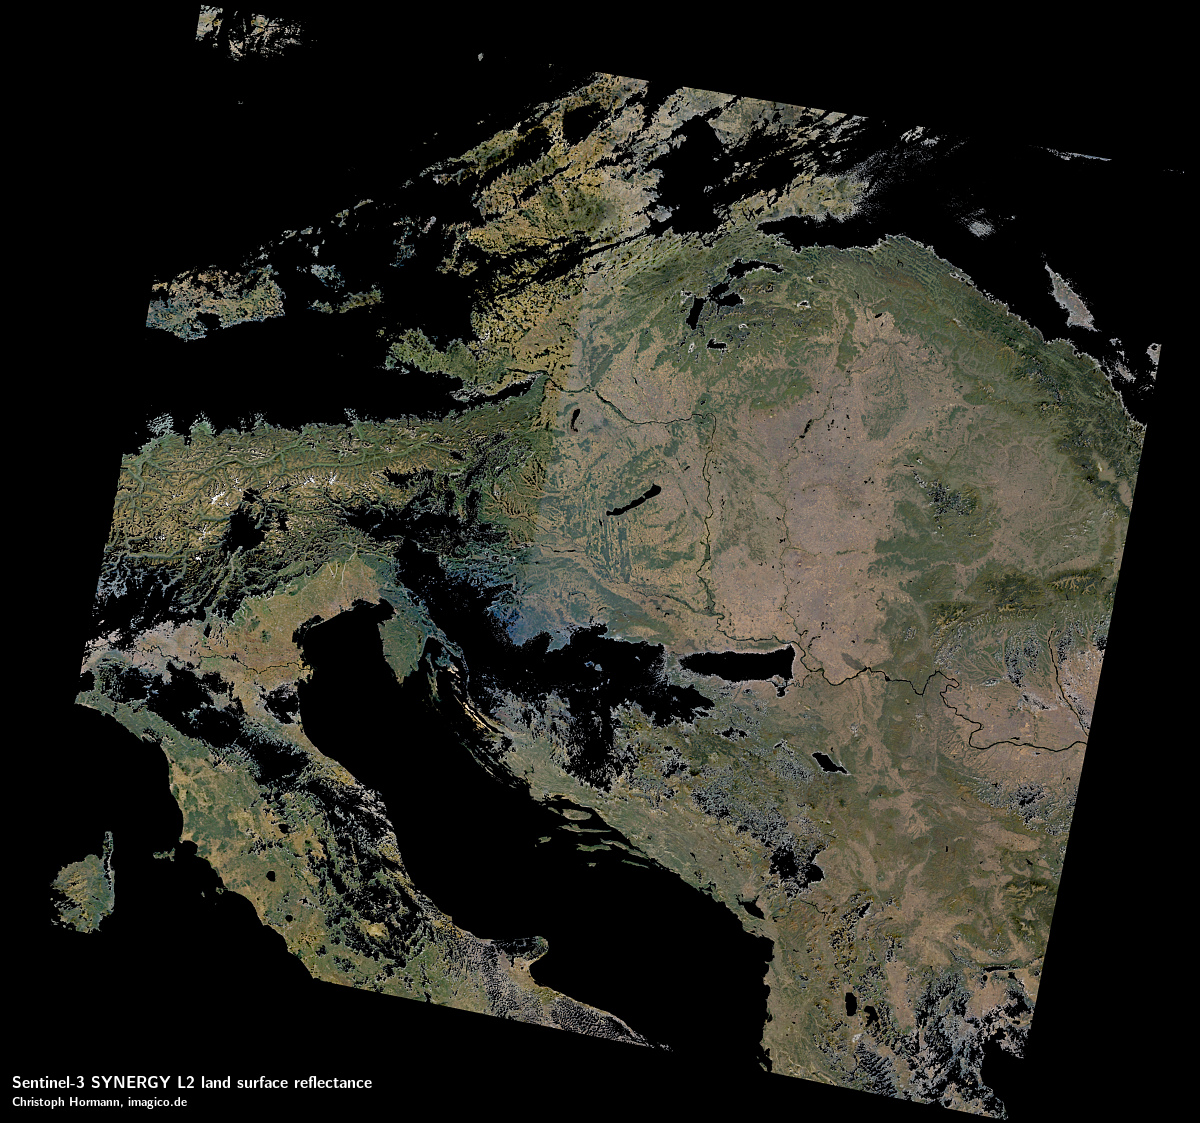
synergy land surface reflectance data in the visible spectrum
A number of things can be observed from this. Clouds are masked and snow and ice seem to be prone to be misinterpreted as clouds and masked as well. Water areas are also not included (including inland water).
As said the SLSTR spectral bands are also included. And since these are re-processed into the OLCI grid they don’t suffer from the SLSTR duplicate pixel geolocation data errors i discussed previously.
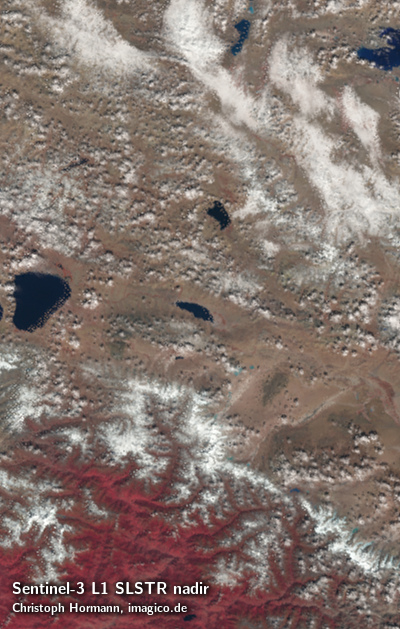
Sentinel-3 L1 SLSTR nadir
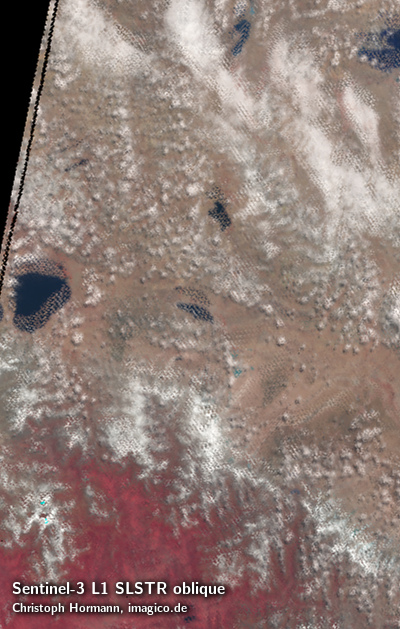
Sentinel-3 L1 SLSTR oblique
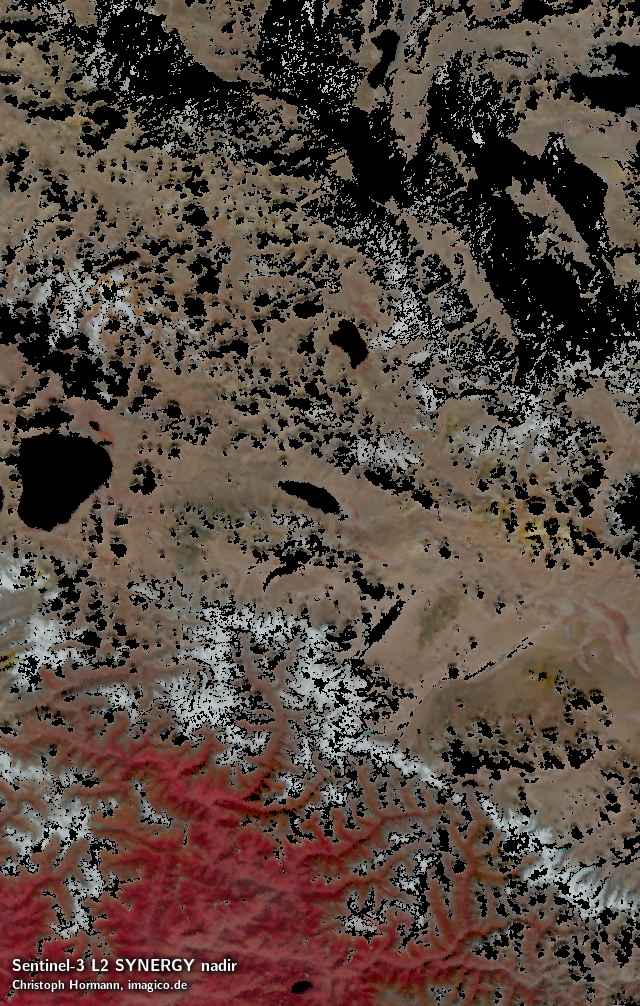
Sentinel-3 L2 SYNERGY nadir
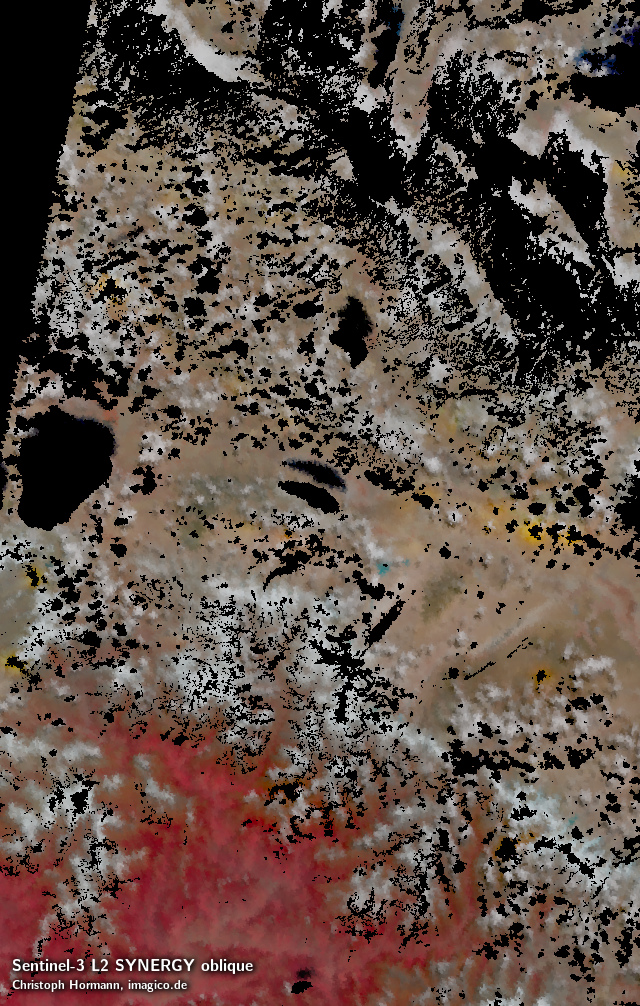
Sentinel-3 L2 SYNERGY oblique
As you can see however the position of the oblique view is now completely skewed – which is further emphasized by the water and cloud masking not matching the data. So i really can’t say i am in any way confident that these people have any idea what they are doing here w.r.t. the geolocation data.
There are also some other serious quality problems. The most obvious one is a usually fairly visible step in the pixel values at the edge of the oblique SLSTR view (see my first Sentinel-3 data review for details). This is because the atmosphere and view direction compensation differs depending on the data available. The claim is that using the oblique SLSTR data makes this compensation more accurate. Here the relevant quote from the product notice on that:
As the aerosol retrieval is supposed to be more accurate on “dual-view” area, a transition between “nadir only” and “dual view” area can be observed in some SYN L2 products. In a majority of products, this transition is visible through sharp differences in the Aerosol Optical thickness Values.
If that is the case the question is of course why they don’t compensate for the systematic offset leading to the visible edge.
Another serious problem is that the nodata mask (that is the set of pixels marked with a dedicated nodata value – in this case -10000) differs between spectral bands. Apparently not all of the nodata pixels are either water areas or clouds, some are also seemingly set as invalid because atmosphere compensation produced extreme values. This occurs in particular with very bright areas (snow) and very dark areas and this invalid value masking seems to be done separately for each spectral band.
Here an example from an area where this is particularly visible. First the version with all pixels with a nodata value in any of the spectral bands set to black
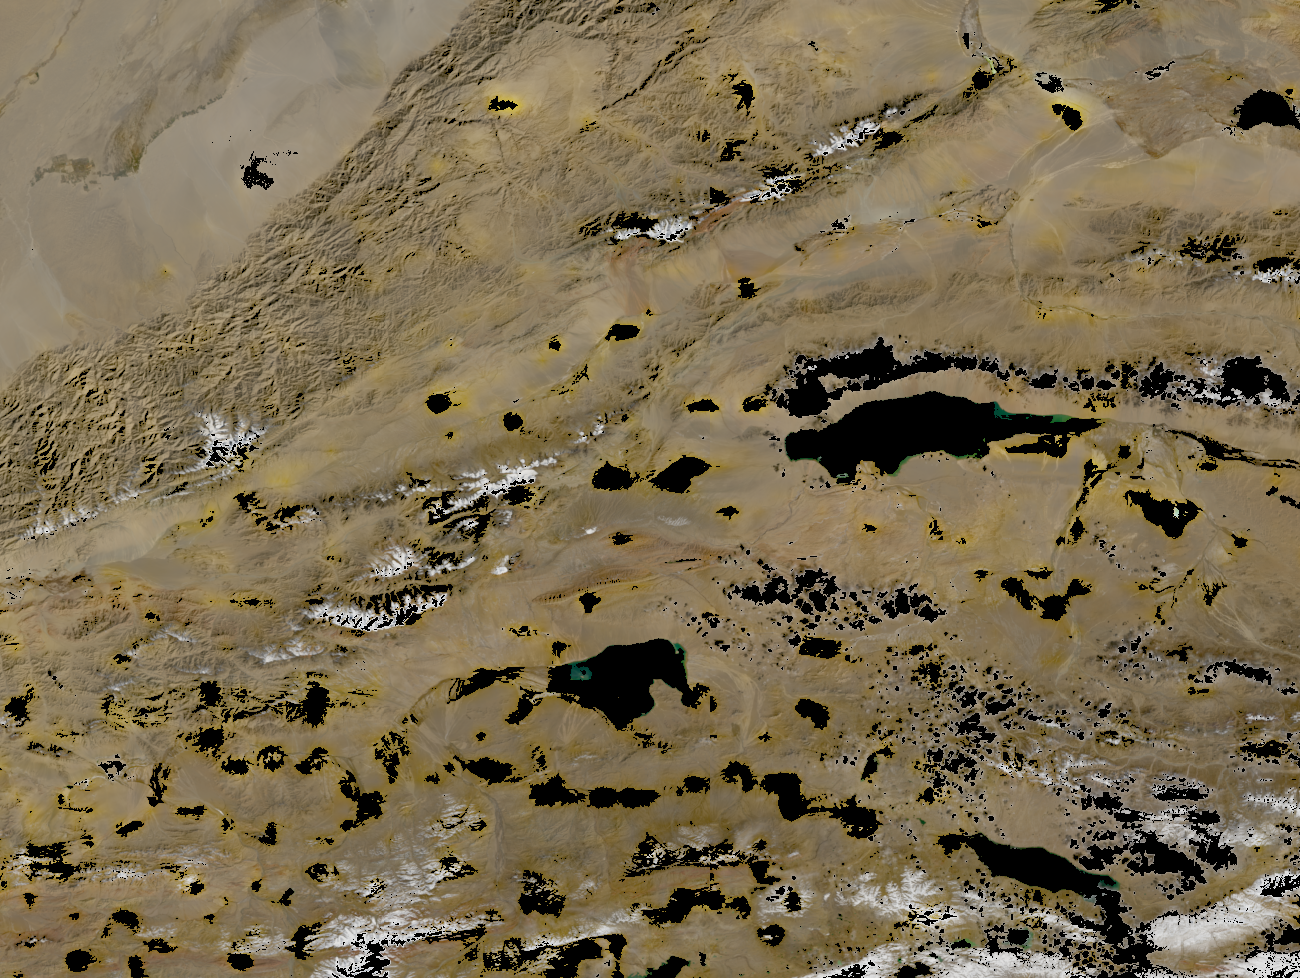
synergy L2 color composite with all nodata masked
And for comparison the version with nodata pixels set to zero independently for every band and then assembled – so the black pixels are only those which are nodata pixels in all of the spectral bands.
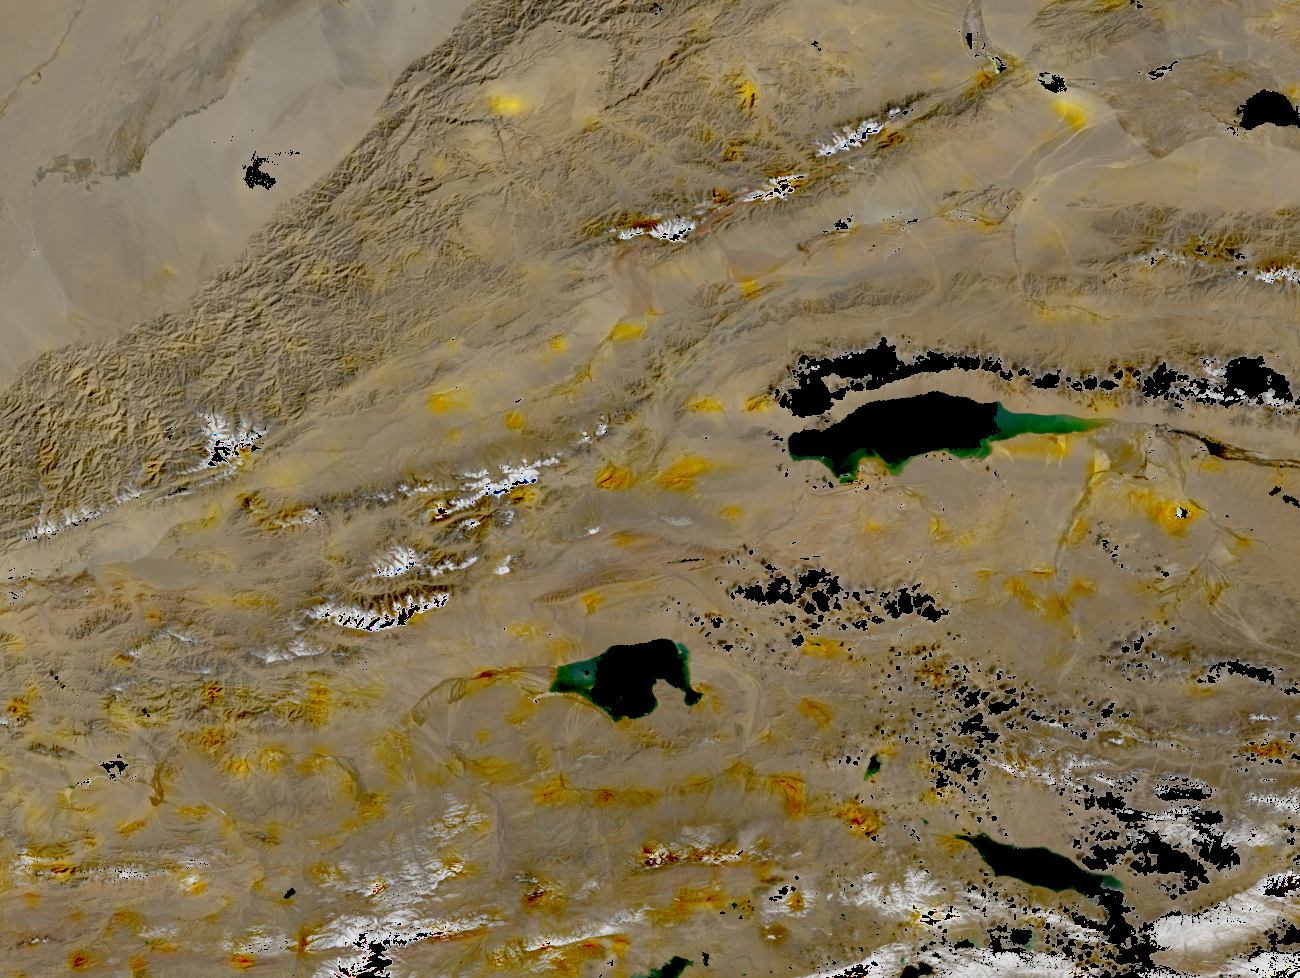
synergy L2 color composite with no overall nodata masking
The yellow spots are what seems to be oscillations in the atmosphere model resulting in invalid values in some of the spectral bands (in particular the blue ones) leading to ghost nodata spots where neither clouds nor water areas are the reason and surface colors are neither extremely bright or dark. And even around these spots in the first variant you can see a yellow halo of severely distorted surface reflectance values meaning that the masking does not actually exclude all pixels where the atmsophere compentation fails to work correctly while it does exclude areas where reasonably accurate values exist (like very bright snow areas).
What you also can see from this sample area is that water masking is fairly arbitrary. The common mask for all spectral bands seems to be in this area both very inaccurate and with a systematic offset.
So even beyond the principal problem of the water masking there are also a number of serious other issues that make this data product much less useful than it could be.
single orbit (VGP), 1 day (VG1) and 10 day (V10) vegetation products
The other newly released data products are vegetation products consisting of four aggregate bands combined from several OLCI and SLSTR bands meant for deriving vegetation indices. These are provided in a plate carrée projection with a nominal 1km resolution at the equator. These are apparently meant as continuity data emulating some historic data product and are therefore of very limited use as a standalone data product. The one day and ten day products are packaged in regional crops for different parts of the world. Here a few examples showing simple NDVI calculations.
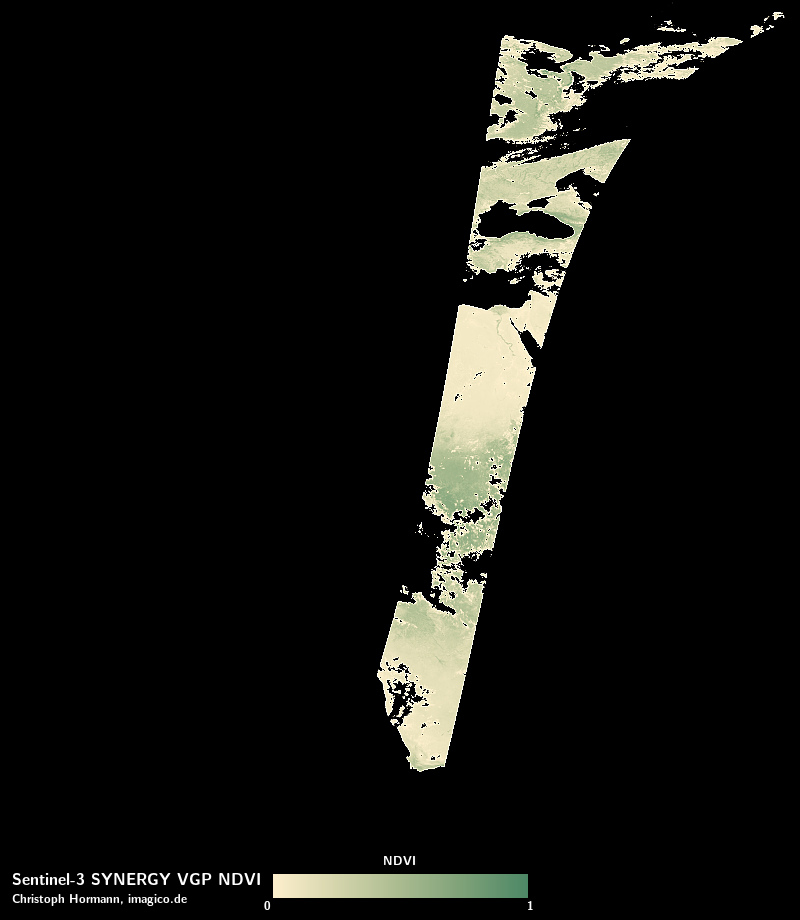
Sentinel-3 SYNERGY VGP NDVI
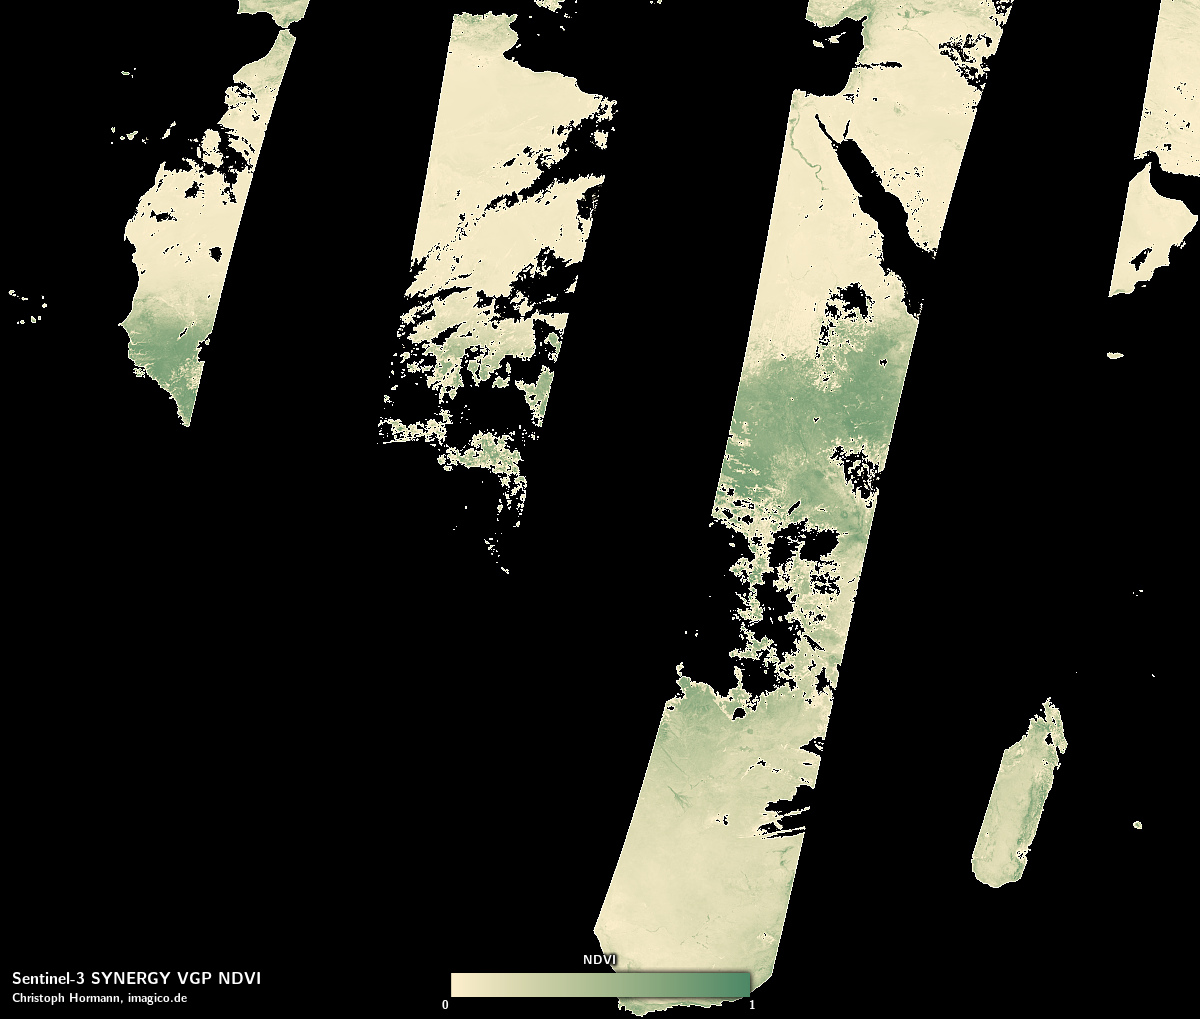
Sentinel-3 SYNERGY VG1 NDVI
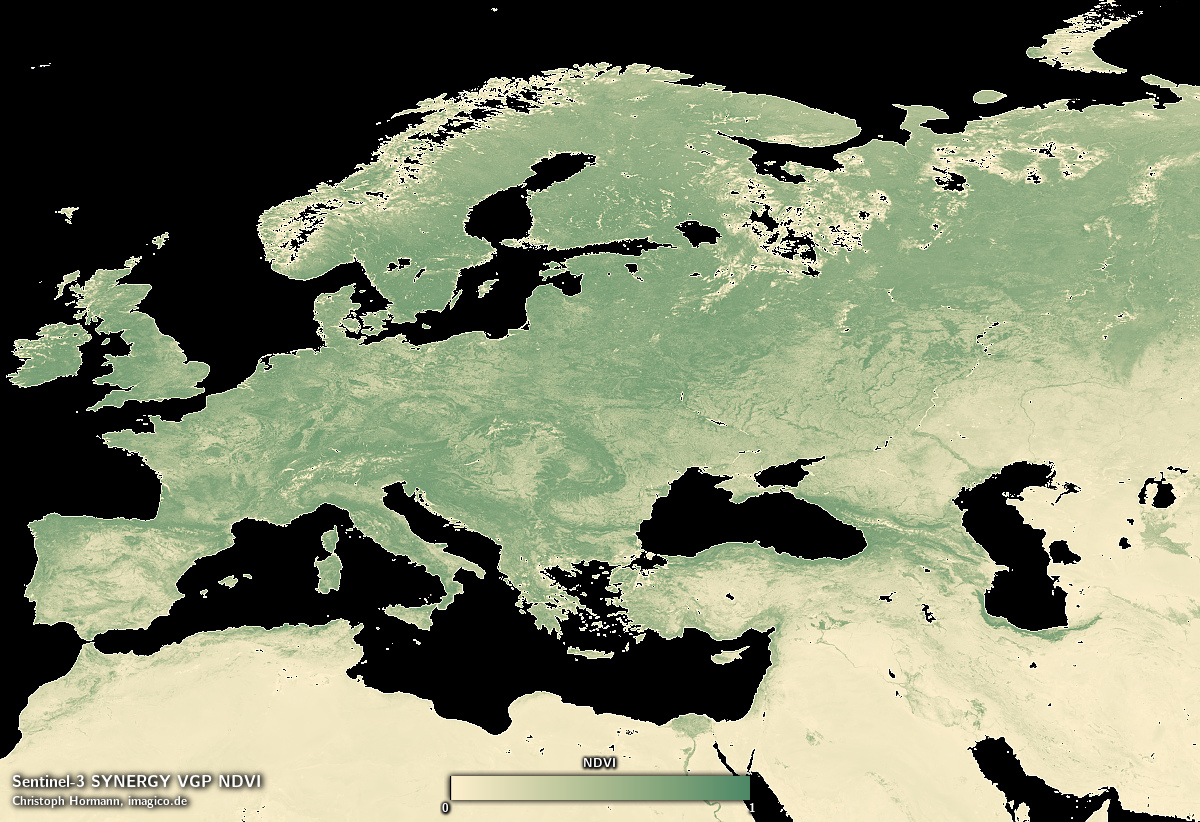
Sentinel-3 SYNERGY V10 NDVI
Apart from the retrofit character of these products with their compound spectral bands and the reduced resolution only publication the very idea of offering temporarily aggregated data products makes a lot of sense – some of the most popular MODIS products are, most of them either daily, 8-day, 16-day, monthly or yearly aggregates. But to produce a useful temporal aggregate product you first would need a solid base product to start with of course.
Conclusions
You have seen what products are available and what issues they come with. Depending on your application these issues might be a problem or they might not. If you are looking for an alternative data source for applications where you currently use MODIS data you are likely out of luck because for most of the widely used MODIS data products there is no real functional replacement in these data products.
Is there a chance for future new products or improvements of existing products improving this situation? Maybe. But i kind of have the feeling this is a pretty severely stalled situation. The SLSTR geolocation problem i pointed out in my first review is still unfixed – and this would be a simple bugfix as far as i can tell, nothing with serious political implications. With many of the design issues with the products discussed here it seems these are not just simple minor neglects, these are systemic planning problems – probably largely the result of the complete lack of familiarity with the very idea of open data products. This is a problem that might take decades to overcome – paraphrasing the famous Max Planck quote: The culture of open data does not triumph by convincing its opponents and making them see the light, but rather because its opponents eventually die (or retire), and a new generation grows up that is familiar with it.