

Landsat 8 - a first look at the data
In February a new Landsat satellite has been launched by NASA and USGS and the USGS has now made available first test data sets and announced it will probably start releasing production data by the end of May. I here will have a quick look at these sample data and what is changed in comparison to previous Landsats. What can be said based on just three scenes released till now and only from the continuous US is limited of course so what i write here should be considered preliminary.
The data from Landsat 8 is released in packages quite similar to previous data - it comes as a gzipped tar archive containing a bunch of GeoTIFF images and a metadata text file. The most obvious difference is that the files as well as the whole archive are much larger - Landsat 7 scenes were usually about 200MB while the new scenes are nearly 900MB. This is despite the fact that spatial resolution of the data was not increased. Reasons for the larger size are:
- There are three additional spectral bands recorded
- The new sensor produces 12 bit data in all channels in contrast to 8 bit data in previous satellites
- There is an additional QA image containing quality assessments for every pixel in the scene
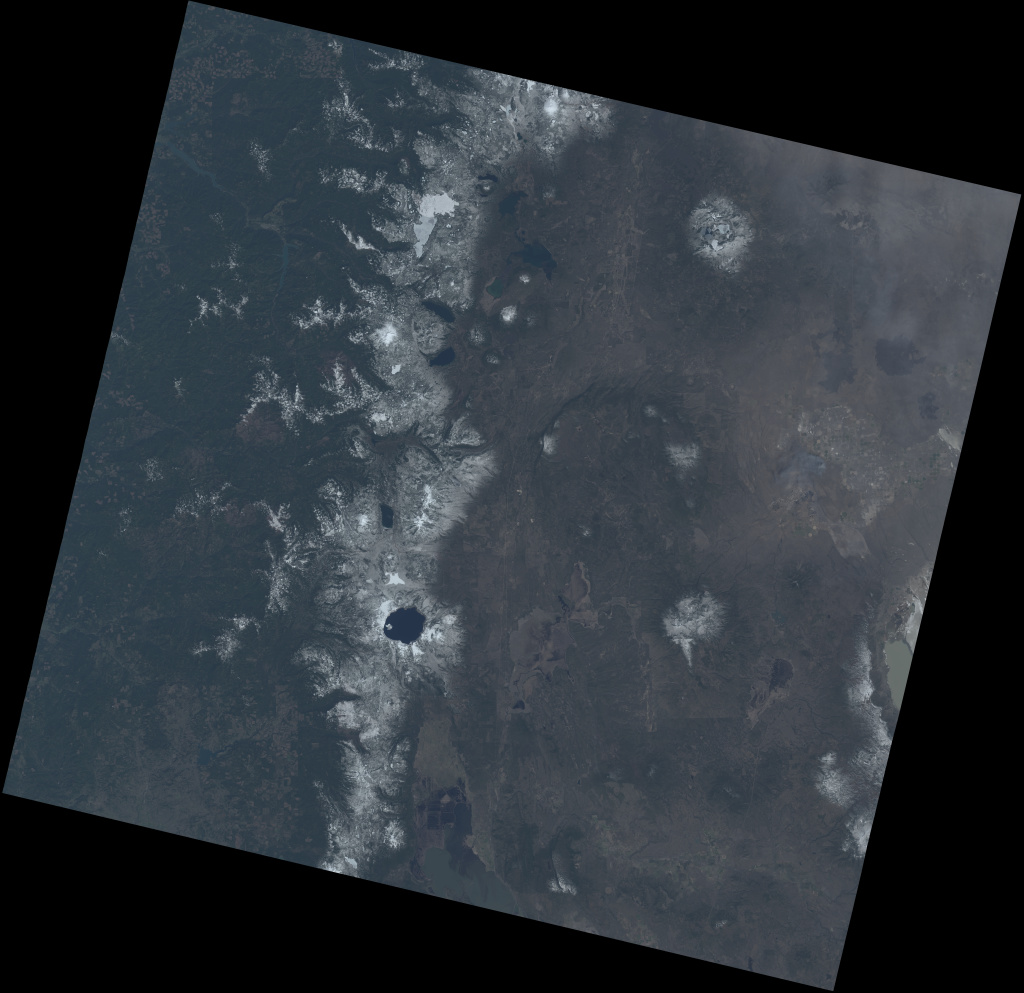
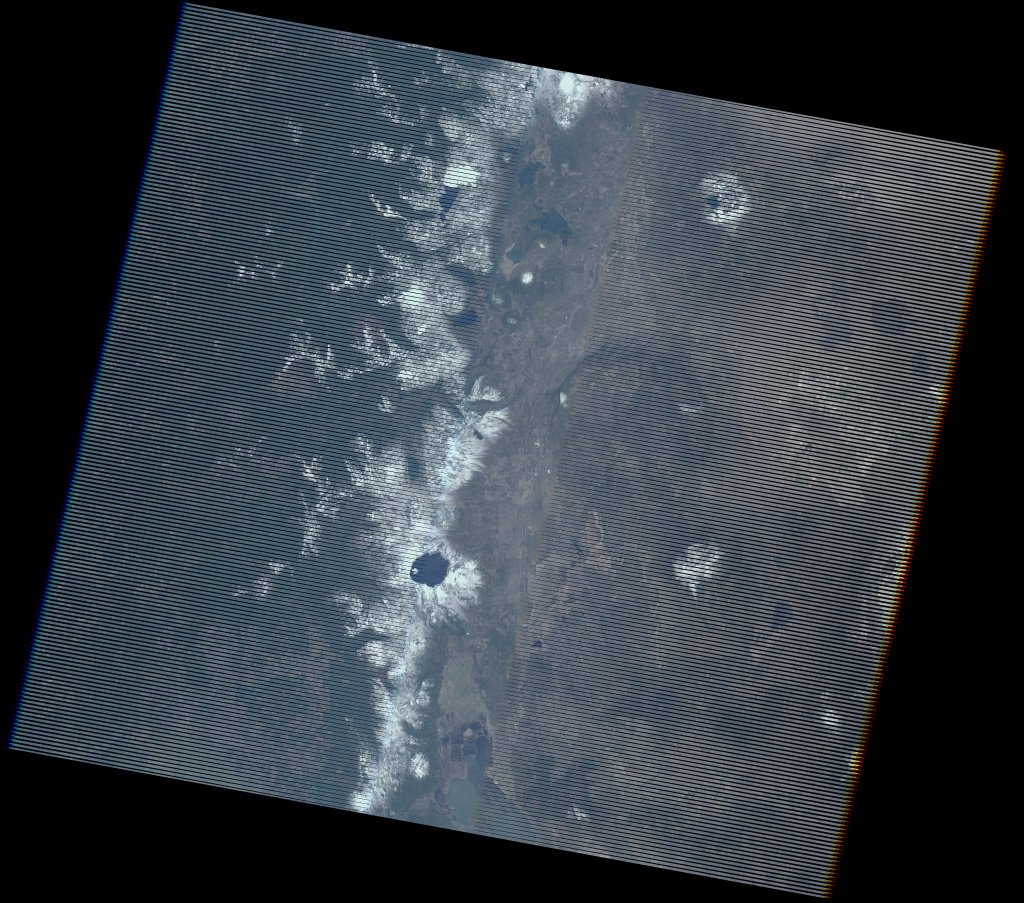
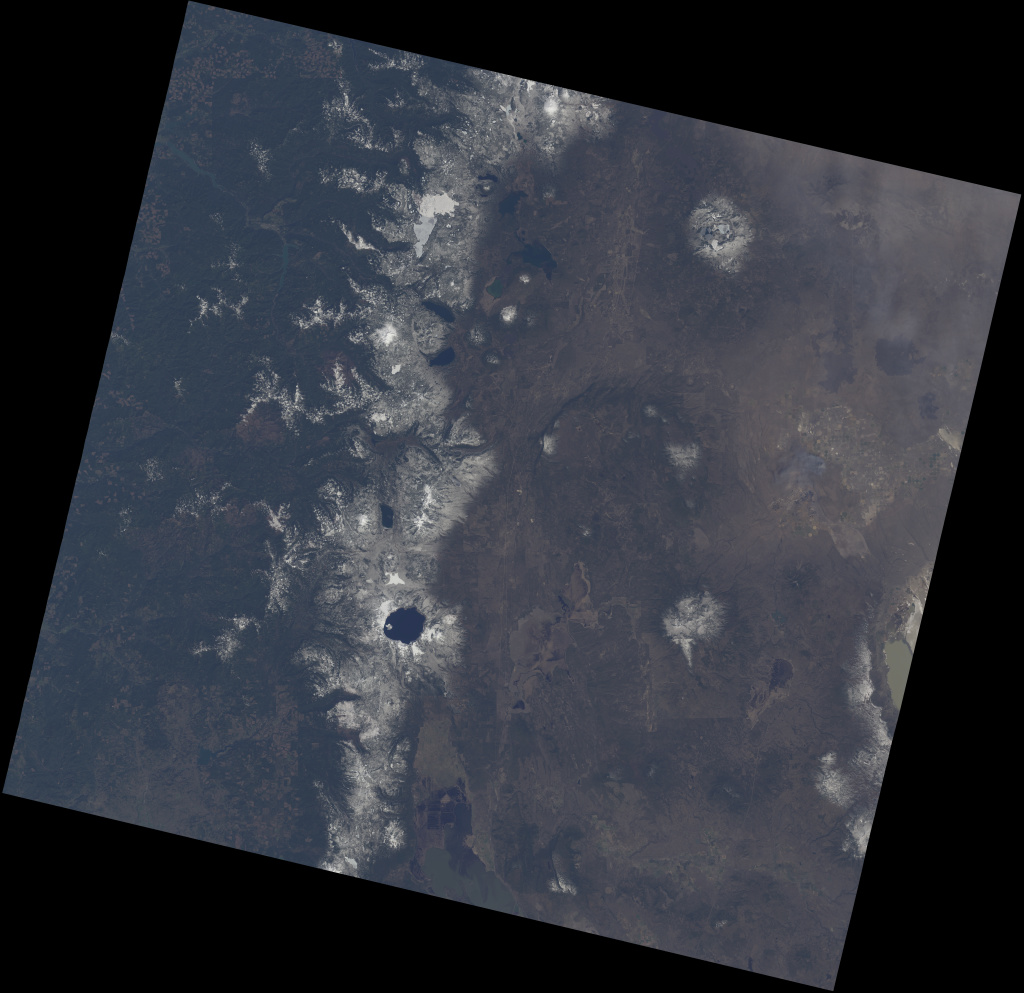
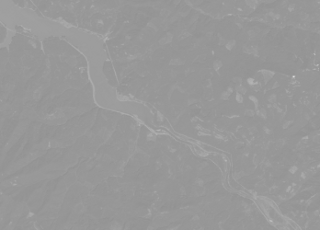
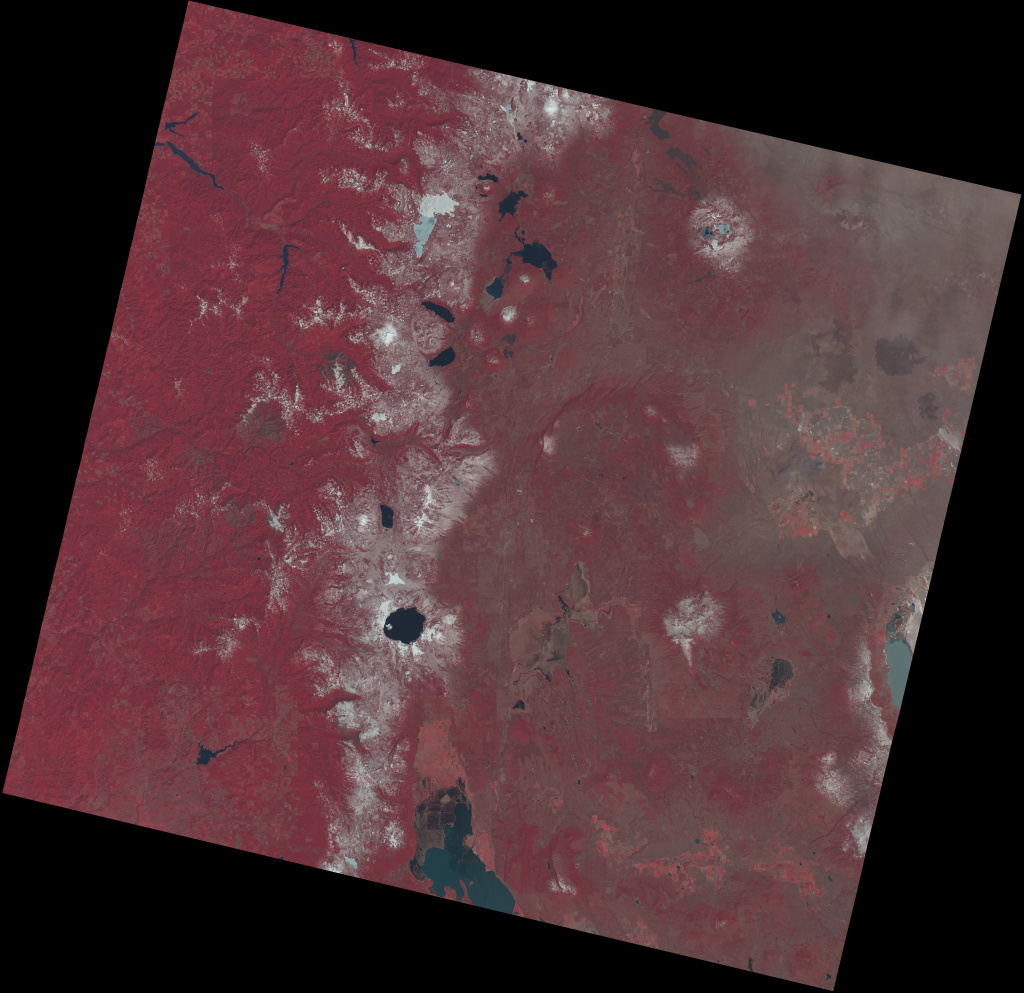
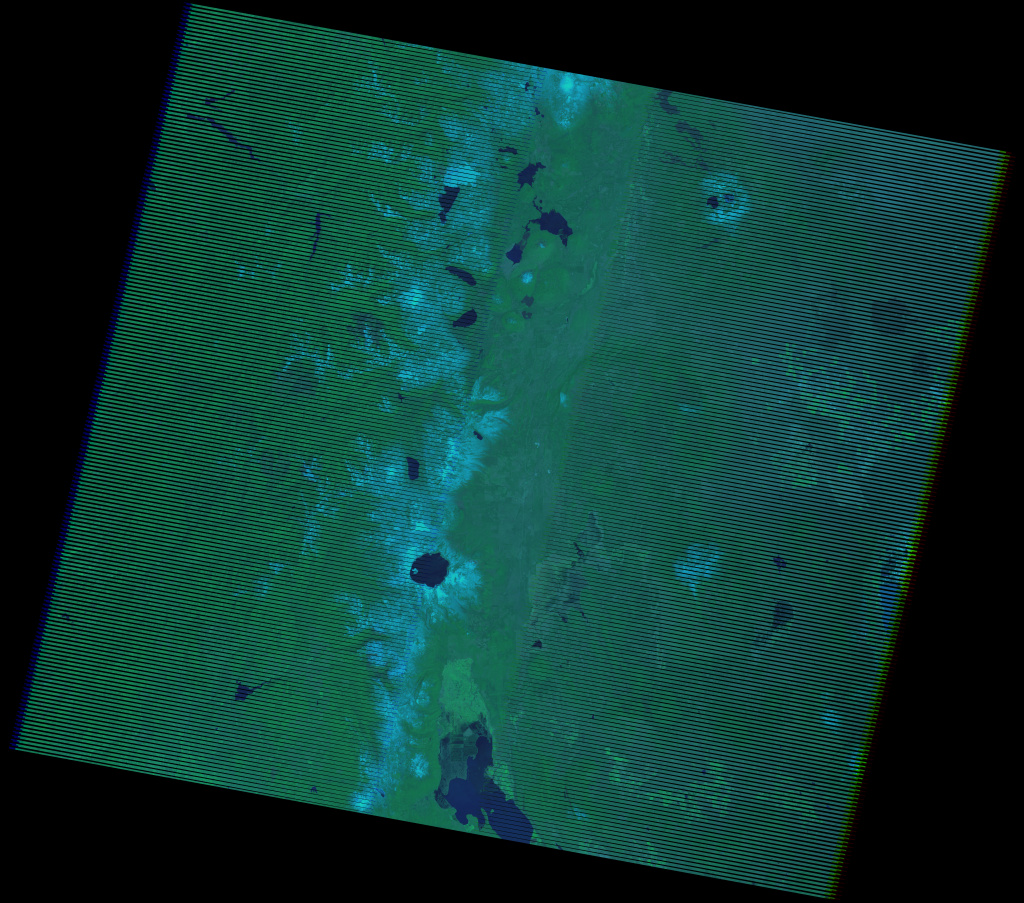
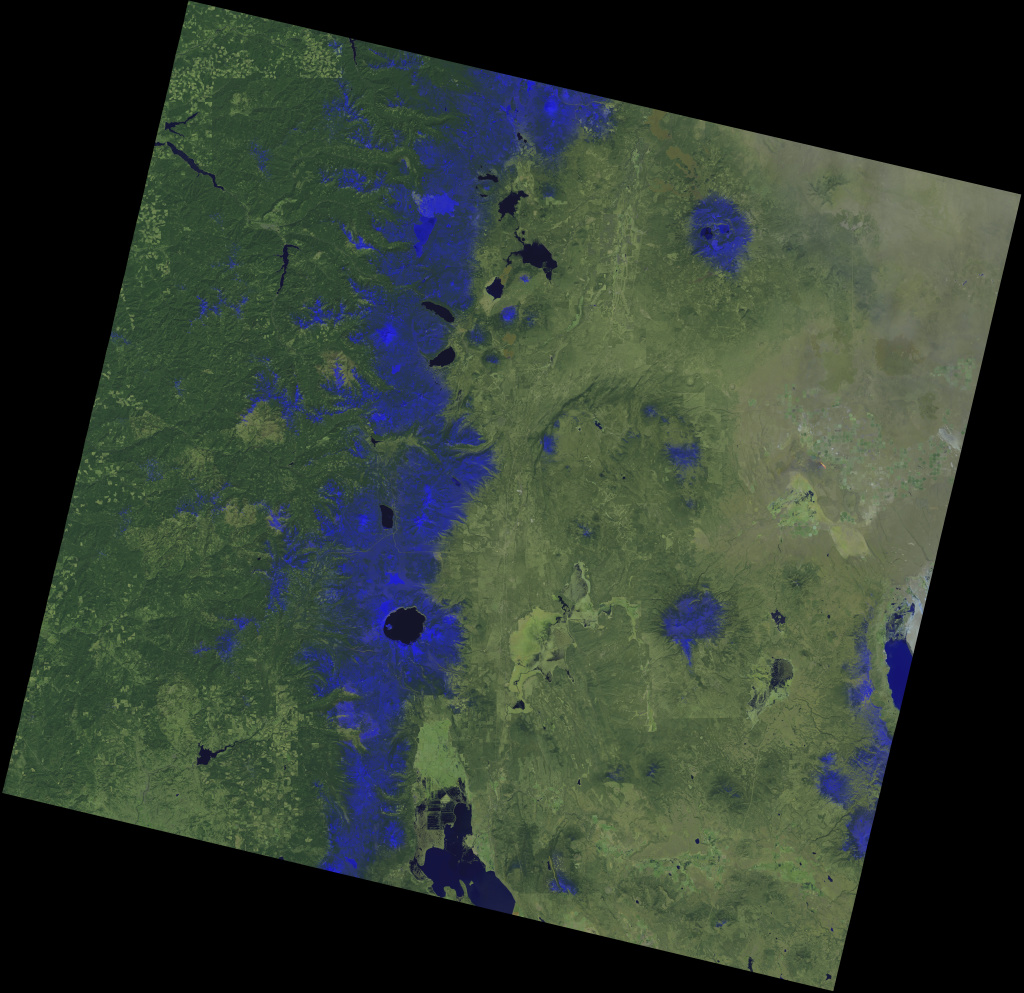
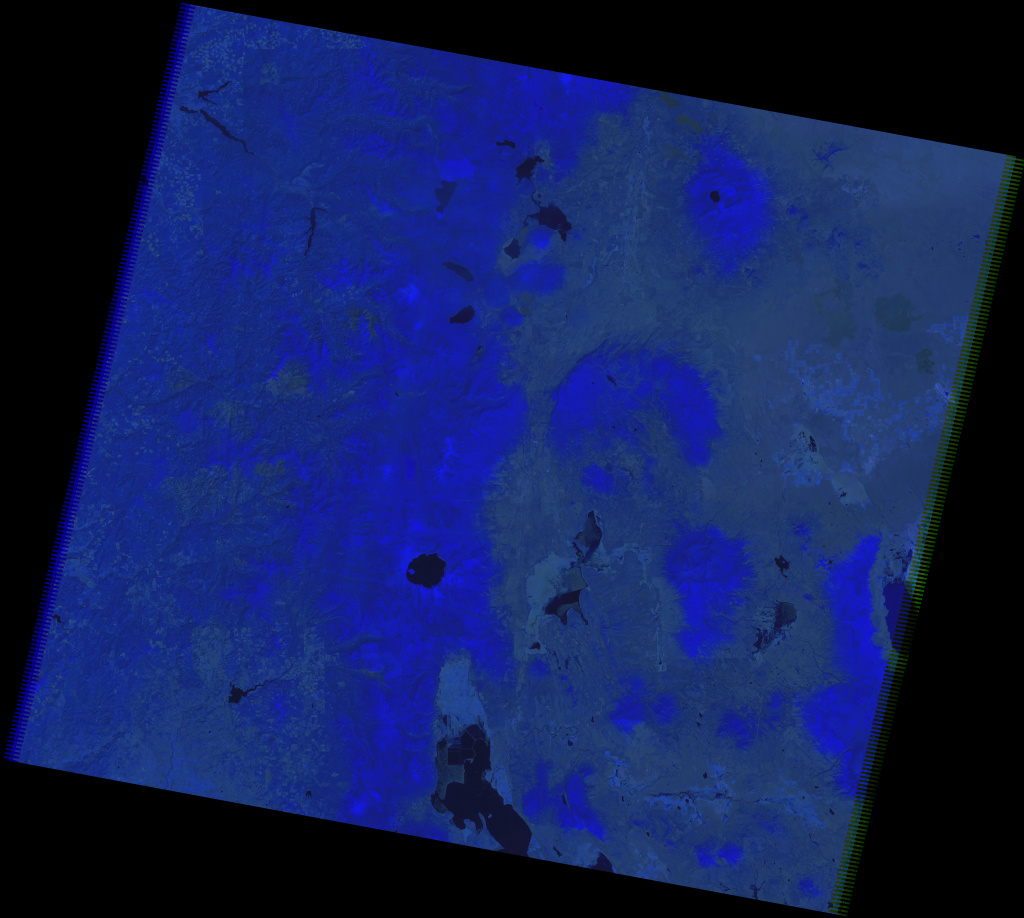
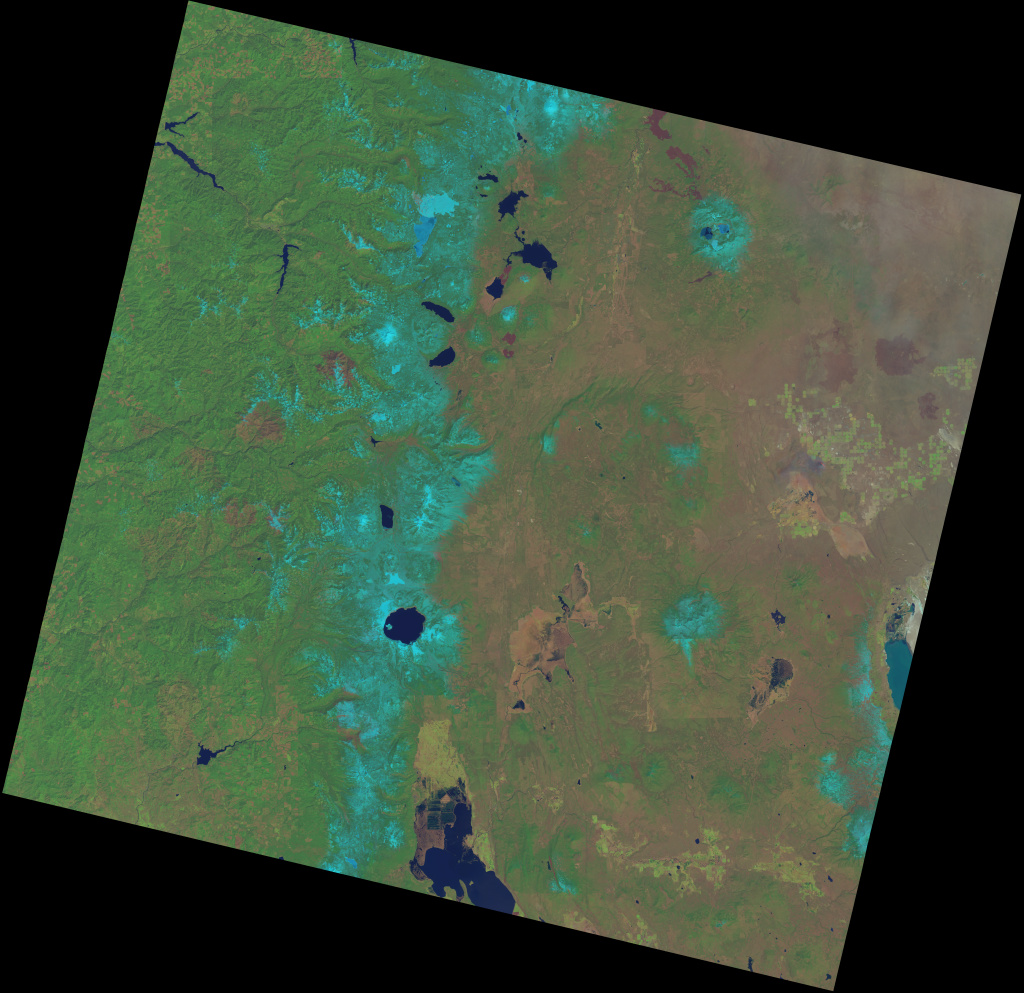
But before i get into the details about these changes a few words on why the new satellite will be very useful as a data source independent of these changes. The following images are generated from data of the three currently operating Landsat satellites (the choice of area and time of year in the Cascade Range in Spring is based on the LS8 sample released by the USGS). These images are produced from the visual spectrum channels without further processing except gamma correction. Note the somewhat dull look is completely normal, this is more or less how the earth looks like from the perspective of the satellite due to the many kilometers of atmosphere in between. Images with stronger colors you see elsewhere are usually either heavily processed or false color infrared images (i will get to the infrared channels later).
|
|
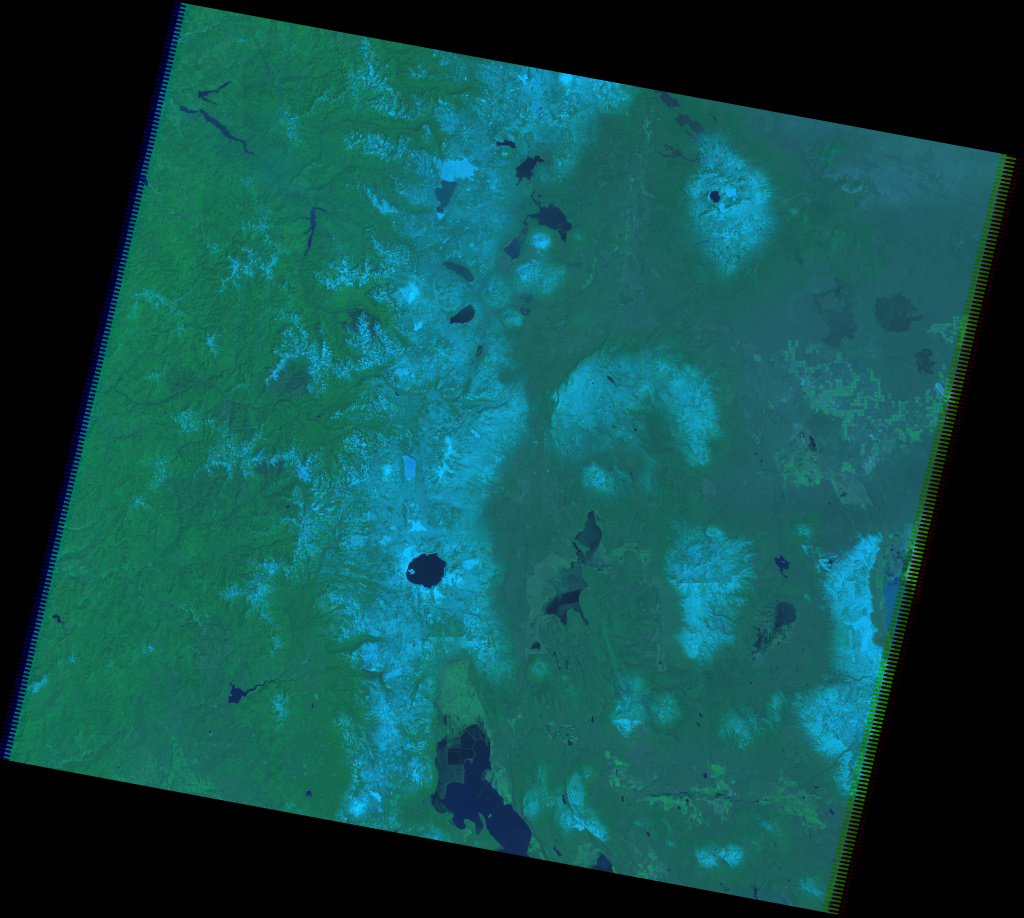
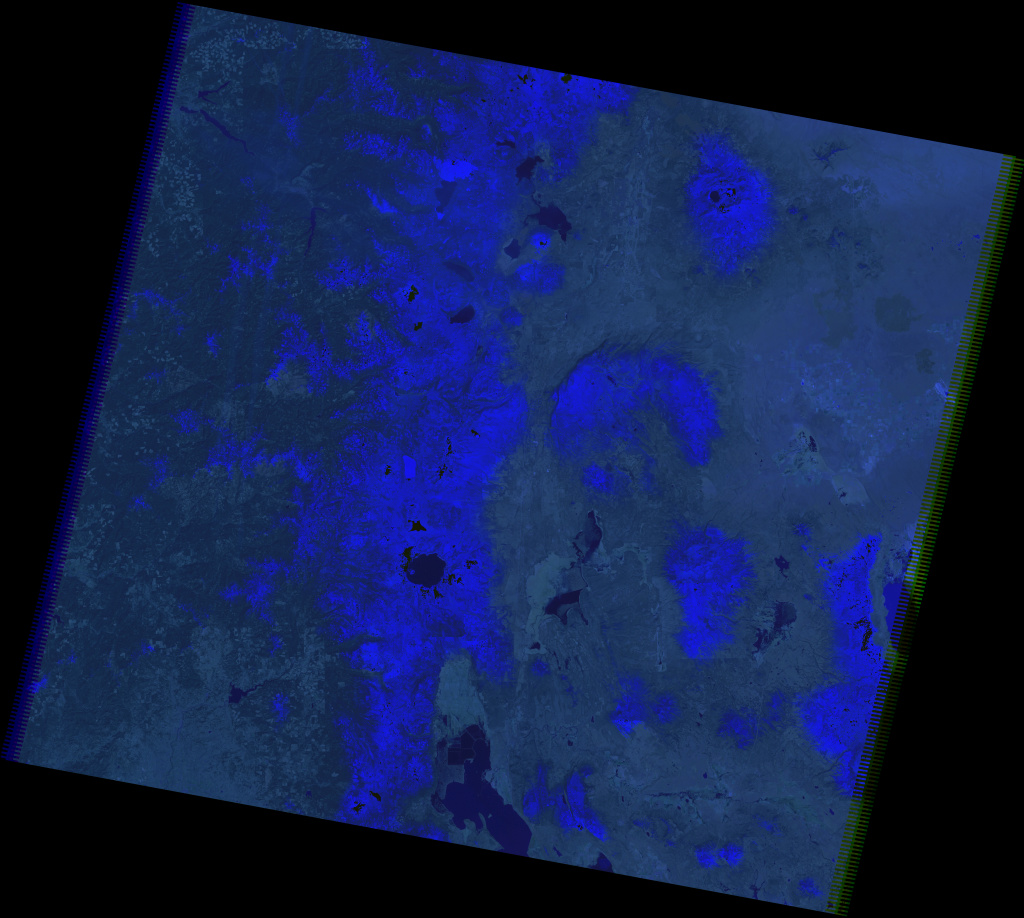
| Landsat 8 full scene visual 432 (2013) | Landsat 7 SLC-off full scene visual 321 (2013) |

|
|
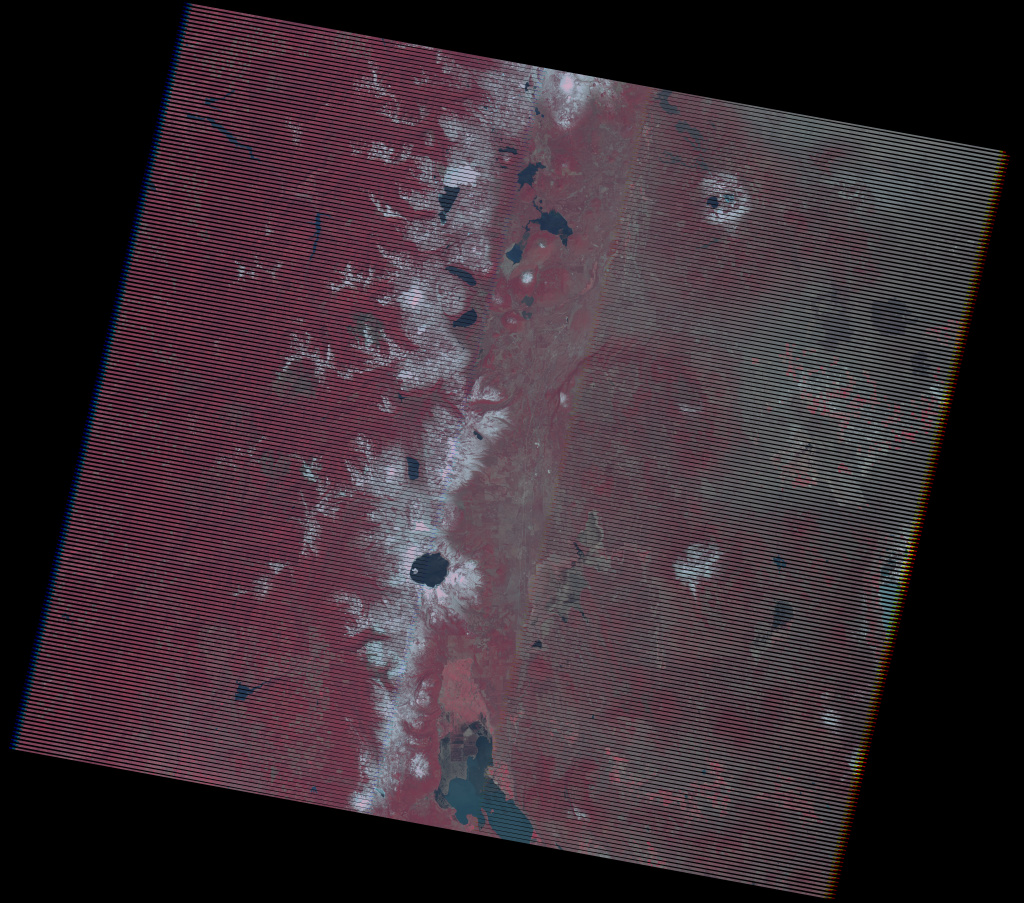
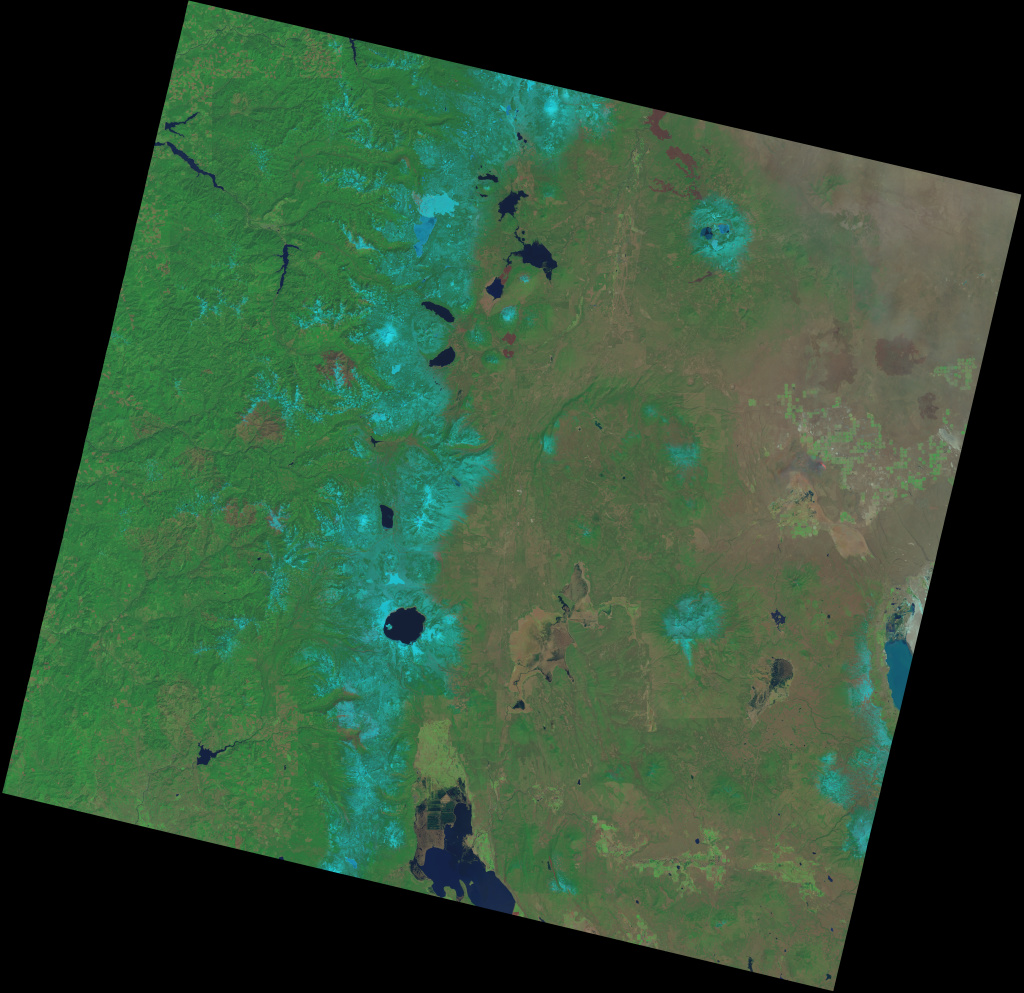
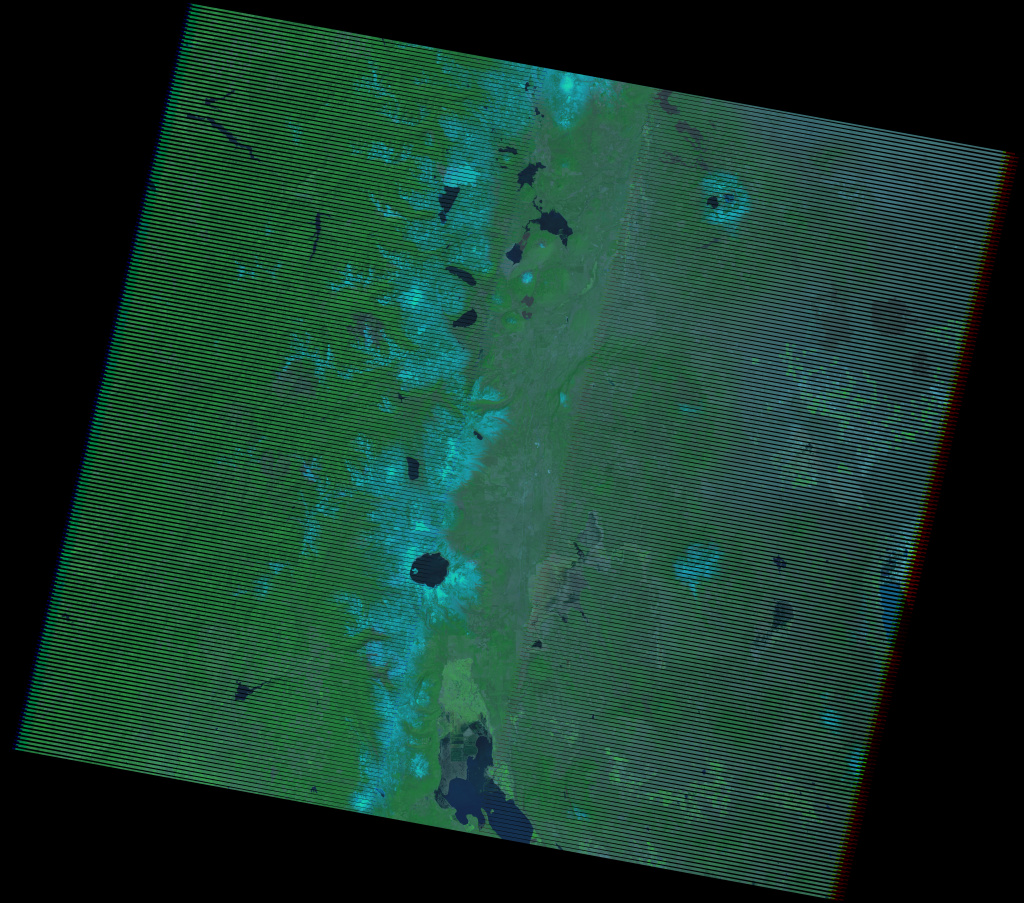
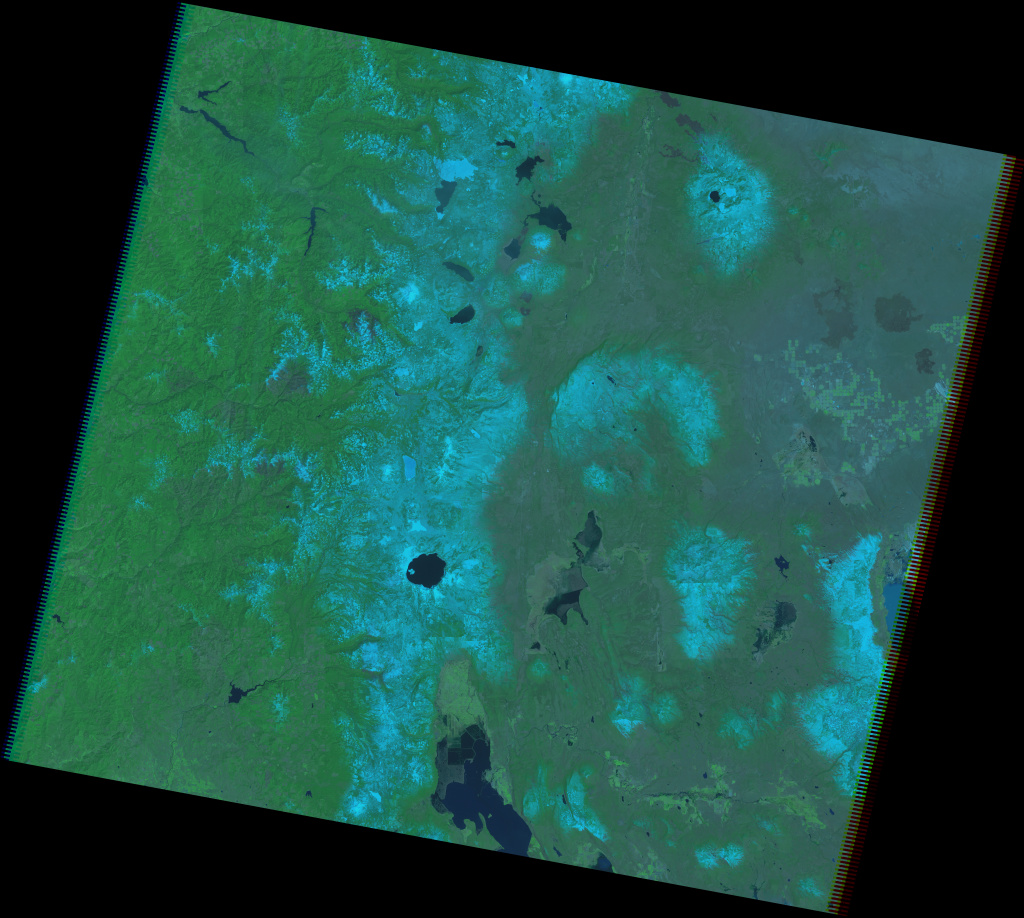
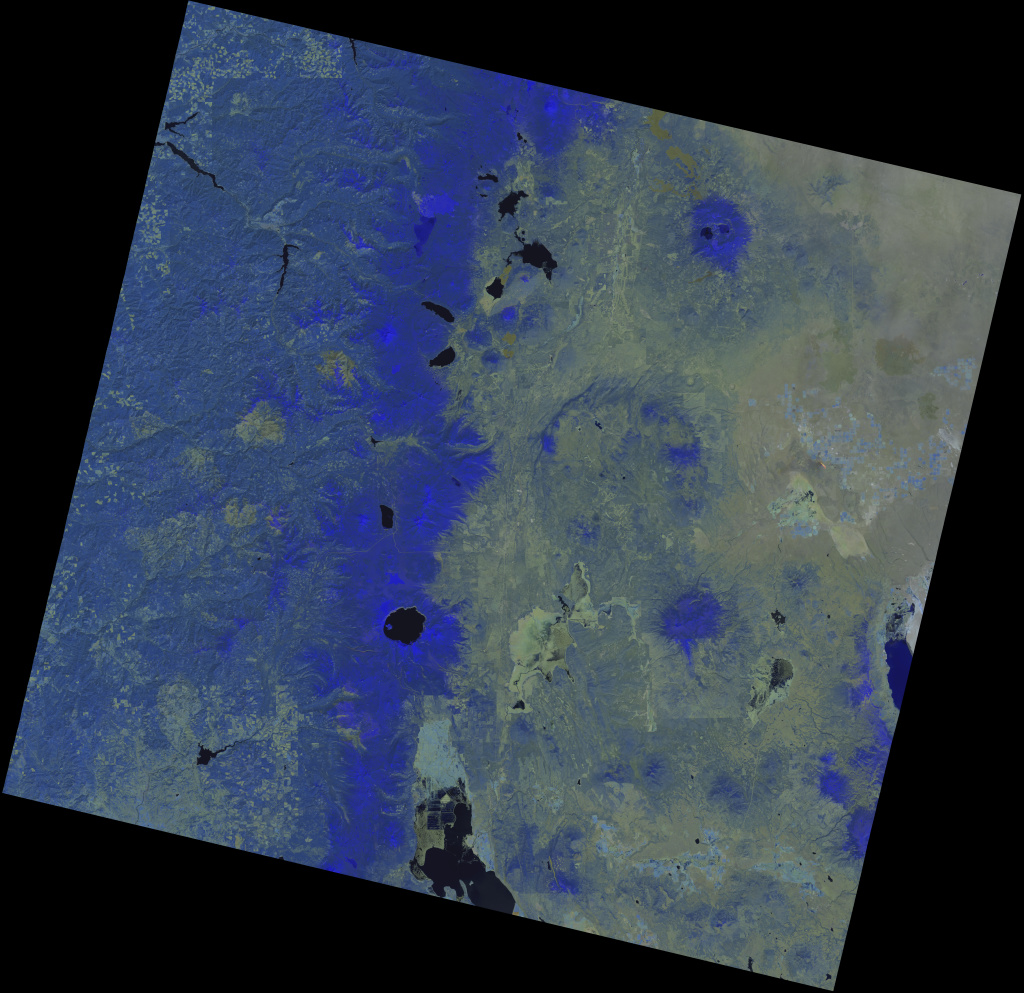
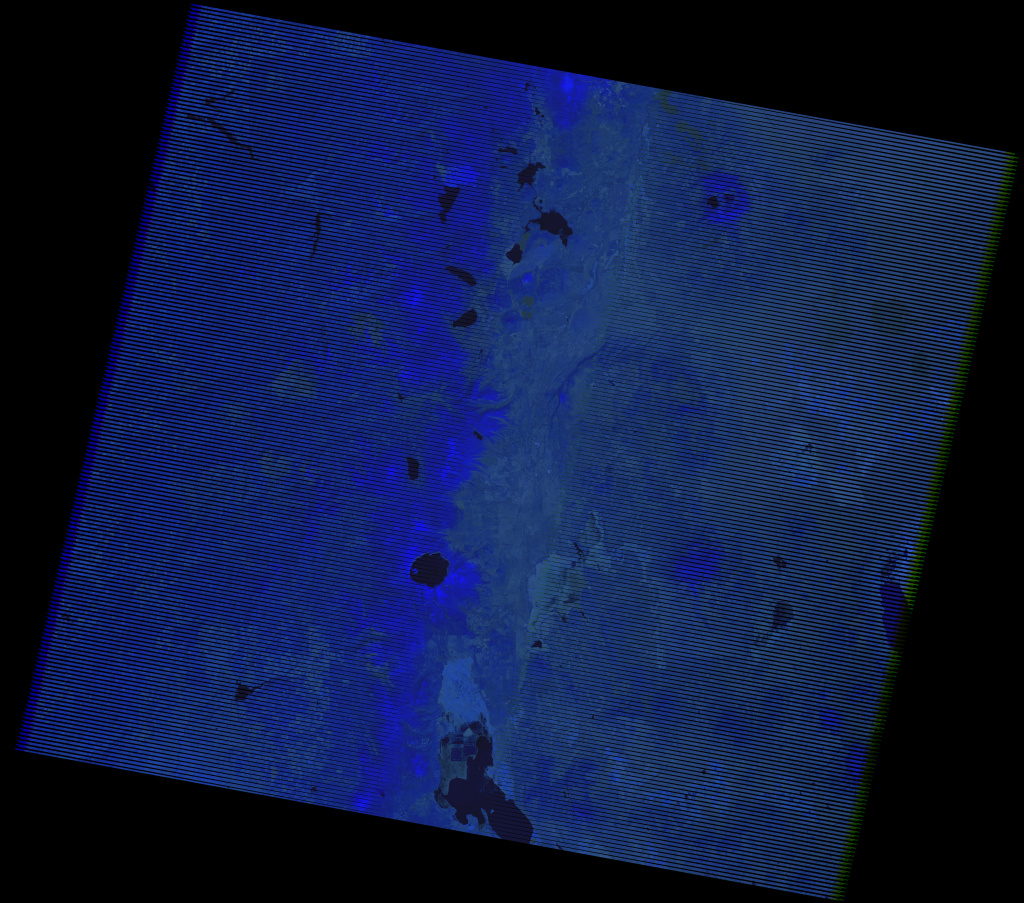
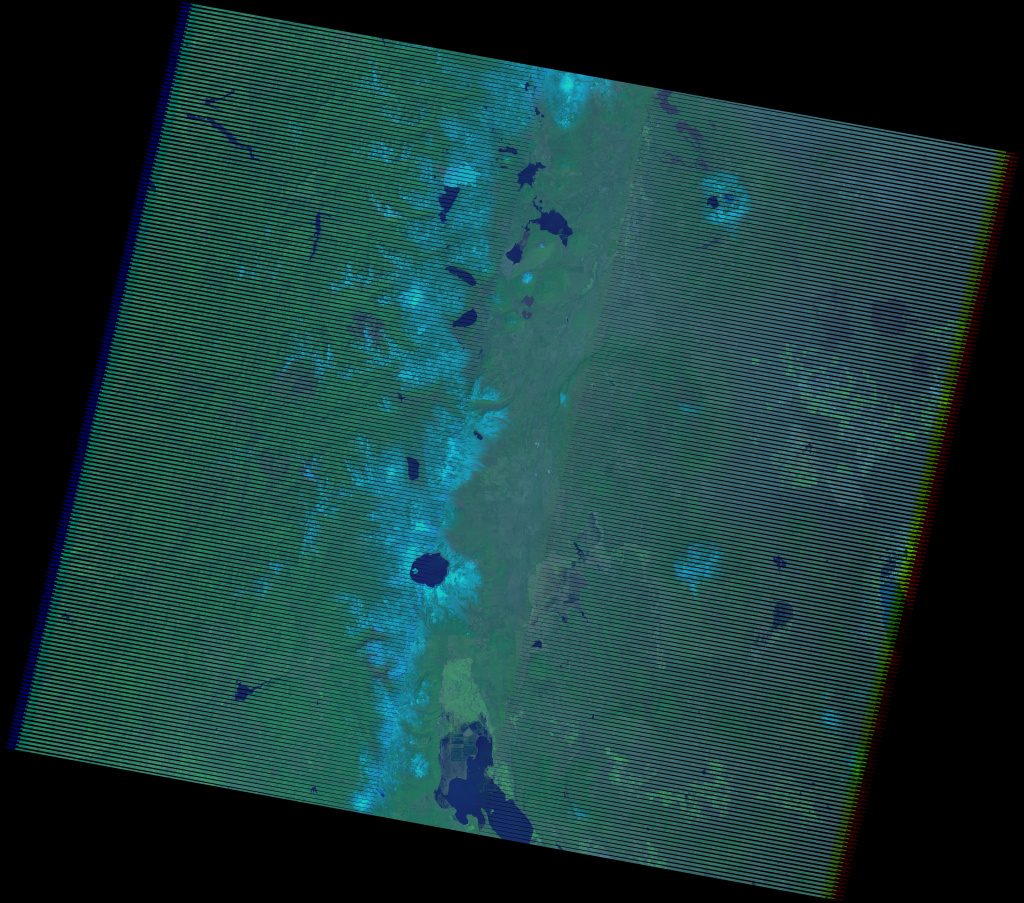
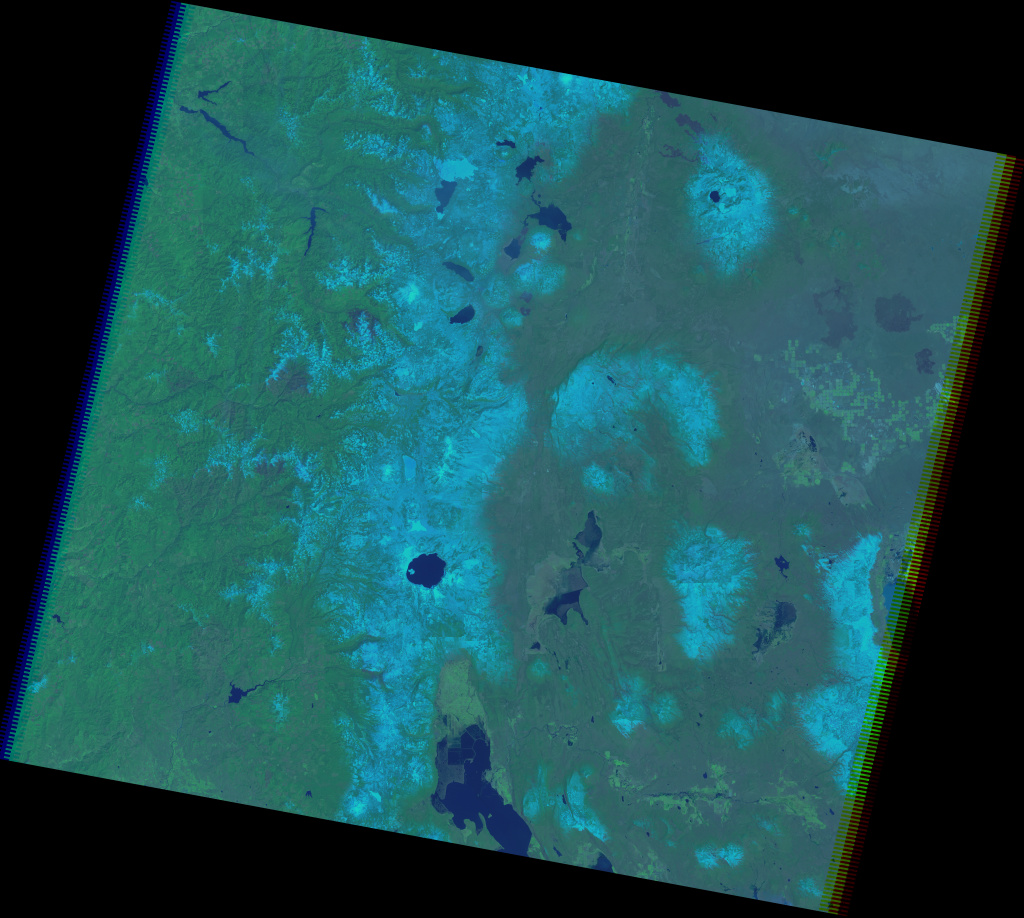
| Landsat 7 SLC-on full scene visual 321 (2000) | Landsat 5 full scene visual 321 (2011) |
These images represent about the most up-to-date data from each of these satellites from this time of year for this area and note this particular area (Cascade Range in the western US) is well covered by Landsat schedules, much better than the global average. Before Landsat 8 we had:
- Landsat 5 which produced images since the 1980s but at a fairly low rate and which stopped delivering image with its main sensor in 2011 (therefore the newest here is from that year)
- Landsat 7 before the SLC failure in 2003 produced a good and high quality coverage of most of the earth but
- these are meanwhile more than 10 years old so can be outdated for a lot of applications.
- coverage is limited so if you look for images from more remote regions, possibly with frequent cloud cover or for a certain time of the year you often cannot find a good image. The scene above for example contains quite some cloud cover.
- Landsat 7 after the SLC failure has been producing images since 2003 resulting in an extensive coverage of the planet but the SLC defect produces gaps (visible when you click on the image above). This severely limits use of the images, in particular for visualization. Therefore nearly all Landsat imagery you can find in services like Google Maps, Bing etc. are from the 1999-2003 period and not the newer SLC-off data.
So in summary all previous Landsats have their problems limiting their usefulness so the new satellite is most welcome. It promises to produce images at a significantly higher rate than Landsat 7 (up to 400 scenes per day) so there is a chance that within 2-3 years a good and up-to-date global coverage is established and will be kept current provided the satellite continues to function.
The new channels and channel changes
One important property of the Landsat satellites has been their ability to record data from a number of different spectral channels distributed across the range where the earth atmosphere is transparent. This does not only cover the visual spectrum allowing color images to be recorded but also covers several parts of the infrared spectrum with particular interest to identify and differentiate earth surface properties. As already mentioned there are three new spectral channels in Landsat 8 in addition to the ones existing already in previous Landsats. The USGS has made this particularly confusing with their numbering of channels. They neither continuously numbered the new channels with respect to their position in the spectrum nor did they keep the previous numbers and added the new channels. Instead channels 7 and 8 keep their number (although their spectral characteristics changed significantly - more on that later) while all others got all different numbers. The following diagram from the USGS will clarify this a bit and i also produced a table with the changes below.

| Band Name | LS8 | LS7 | LS5 | Notes on differences in LS8 |
|---|---|---|---|---|
| coastal aerosol, ultra-blue | 1 | - | - | new |
| blue | 2 | 1 | 1 | more narrow |
| green | 3 | 2 | 2 | more narrow |
| red | 4 | 3 | 3 | more narrow |
| near infrared (NIR) | 5 | 4 | 4 | more narrow |
| short wave infrared (SWIR) 1 | 6 | 5 | 5 | more narrow |
| short wave infrared (SWIR) 2 | 7 | 7 | 7 | more narrow |
| panchromatic | 8 | 8 | - | more narrow, only visible (red-green) |
| cirrus | 9 | - | - | new |
| thermal infrared 1 | 10 | 6 | 6 | two bands instead of one |
| thermal infrared 2 | 11 | 6 | 6 | two bands instead of one |
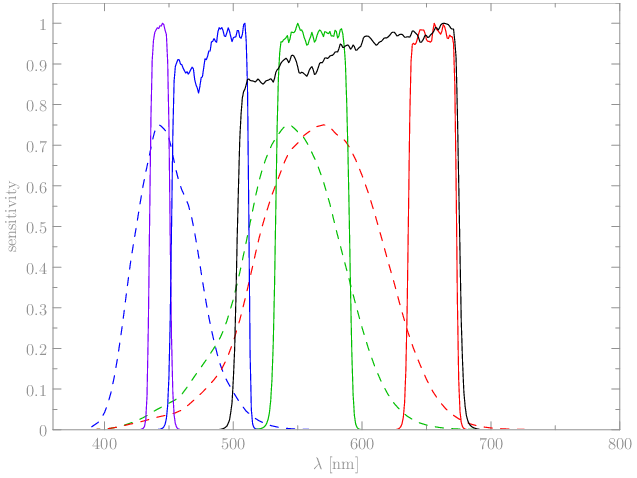
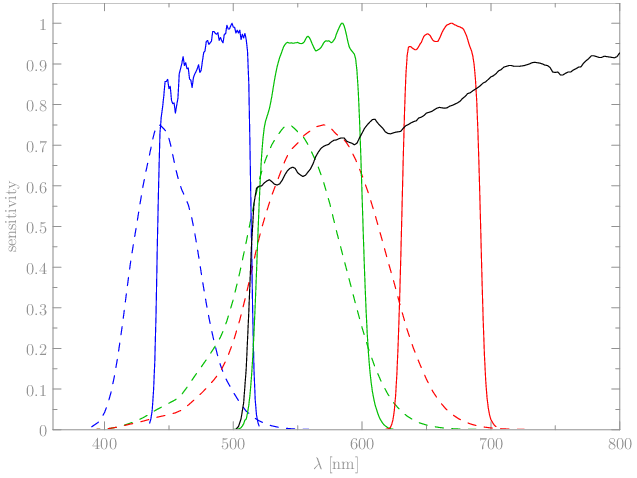
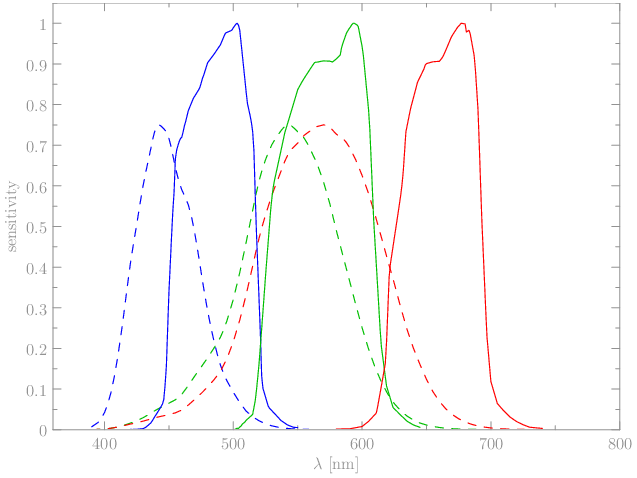
I will not cover the thermal infrared here which has been split into two channels but instead will concentrate on the lower wavelengths. As indicated in the table above all existing spectral channels have been narrowed in their spectral range. This is usually believed to allow more precise analysis of the earth surface. I will have a look at this more closely in the visual range. The following diagrams illustrate the spectral sensitivities of the visual range channels from the different Landsat satellites as published by the USGS:
|
|
|
| Landsat 8 | Landsat 7 | Landsat 5 |
Drawn in dashed for comparison are the sensitivity curves of the human color vision. Comparing Landsat 7 and 8 we can see the following differences:
- All channels are narrowed in their spectral range in comparison to LS7, in particular the red channel.
- The new channel 1 is located right at the maximum of the human eye blue sensitivity.
- The panchromatic channel with a higher spatial resolution that previously extended far into the infrared is limited to the visual range extending slightly further into the blue.
The first idea that comes to mind when looking at these characteristic is that the new channel 1 might be much better as a blue channel than the conventional blue channel which was more a blue-green channel in the first place. We can try this out:
|
|
|
| visual color based on channels 432 | visual color based on channels 431 |
The differences are subtle but the most prominent one is the appearance is more bluish and less contrast than the normal visual rendering. This is caused by the fact that at the shorter wavelengths covered by the channel 1 the atmosphere is much less transparent. This is not only due to aerosols as indicated by the channel name but also simply due to the scattering of the air molecules (the same effect leading to the blue color of the sky). This means images using this channel combination to approximate visual appearance will look less contrasty with a bluish tint. Therefore i doubt this channel combination (or any mixing of the blue channels) will gain much popularity. If you compensate for the atmosphere effects though the use of the new shortwave blue channel might allow better differentiation of blue tones. Judging from this single sample scene the advantages seem subtle but this might be different in other areas.
The other question concerning the visual range channels is how the change in spectral range, in particular of the red channel, will affect color reproduction. One important thing to keep in mind is that for accurate colors it is not necessary for the spectral channels to precisely resemble the human vision spectral characteristics in every channel individually. The real requirement is the so called Luther condition that you can accurately resemble the human vision characteristic by linear combination of the sensor spectral channels. Here lies the problem since as you can see in the diagram above the human eye has significant sensitivity in the gap between the red and green channel between about 600 and 630nm which is not recorded by the satellites spectral channels (it is by the panchromatic channel i will talk about next but this is of no use since this also extends into the green and beyond). So surface features reflecting in the 600-630nm that would trigger a significant red perception will go unnoticed by the Landsat 8 sensor. How problematic this will be in practice to get accurate colors remains to be seen.
The reason for this apparently not very sensible design decision is likely that as mentioned above analysis of the data to identify surface properties will often profit from narrower channels. Accurate color visualizations have probably not been a primary objective.
The third major change in the visual range concerns the panchromatic channel drawn in black in the above diagram. This channel offers a double spatial resolution and has often been used with Landsat 7 data for so called pansharpening to produce a color image with high spatial resolution. The fact that the panchromatic channel of Landsat 7 extended far into the infrared made this difficult and prone to color shifts in areas with a significant infrared response. The new satellite limits sensitivity to the visual range promising better and easier pansharpening. On the other hand the old panchromatic channel was very good to identify small water features within vegetated areas (like narrow rivers) for which the higher spatial resolution is particularly handy since in the near infrared the vegetation (bright) contrasts very well with the water (dark). You can see the effect in the following sample crop:
|

|
| panchromatic channel from Landsat 8 | panchromatic channel from LS7 (with SLC gaps) |
So far for the visual range channels, the channels in the infrared range have been narrowed as well, in particular channels 5 and 6 in comparison to 4 and 5. Infrared data is usually displayed in the form of false color composites assigning certain infrared bands to the red, green and blue channels of the display. There are certain band combinations that have been established but it should be noticed that these are just a result of convention and have no inherent meaning. In fact you could map the color space defined by the landsat bands in an infinite number of ways to the 3d rgb color space for display.
In the following table you can find some common band combinations with sample images from the different satellites:
| LS8 | sample | LS7/5 | sample LS7 | sample LS5 |
|---|---|---|---|---|
| 543 |
|
432 |
|

|
| 753 |
|
742 |
|
|
| 654 |

|
543 |
|
|
| 764 |
|
753 |

|
|
| 765 |
|
754 |
|
|
| 652 |
|
541 |
|
|
One should be careful not interpreting too much into the visual appearance, especially considering these images were not taken at at the same time. But it should be obvious that there are significant differences in the results due to the changed spectral characteristics and that the changed bands might better differentiate surface types. It can for example be seen that band 5 (4 in LS7/5) is clearly much more uniform across the scene in Landsat 5 and 7 than it is in the new satellite.
Finally the new channel 9 covers a very narrow band in the infrared meant to identify high altitude cirrus clouds. These clouds are difficult to identify in the normal spectral channels but they influence appearance of the surface features below making interpretation more difficult. I have not looked much at this yet. There is a field in the QA data containing cirrus cloud information apparently based on a simple thresholding of this channel.
From 8 bit to 12 bit
The other large change in LS8 is the increased bit depth of the satellite data. The most obvious effect of this change is in the handling of the data - the new image files contain 16 bit values (with the 4 least significant bits empty) in contrast to the previous 8 bit data. This might pose problems to some users of the data since many imaging programs on computers only deal with 8 bit images. Geographic data processing as well as professional image editing has long been able to process 16 bit data so such troubles should be the exception.
The effect of increased bit depth can best be described by comparing to the corresponding differences in digital cameras. Digital cameras just like satellite sensors have analog-digital converters translating the analog signal of light intensity recorded by the sensor into digital numbers. The resolution of these converters is determined by the number of bits of the numbers they produce. This number of bits imposes a fixed limit to the ability of the system to differentiate subtle differences in light intensity, it is however often not the factor actually limiting this ability since noise from various sources could be much higher. In case of digital cameras current models have either 10, 12 or 14 bit AD converters but few of them actually make full use of their abilities since technological improvements have mostly focused on increasing spatial resolution.
In case of Landsat the spatial resolution has not been increased from Landsat 7 and there is a I will explain the effects in case of the Landsat data with the following images showing the area around Crater lake.
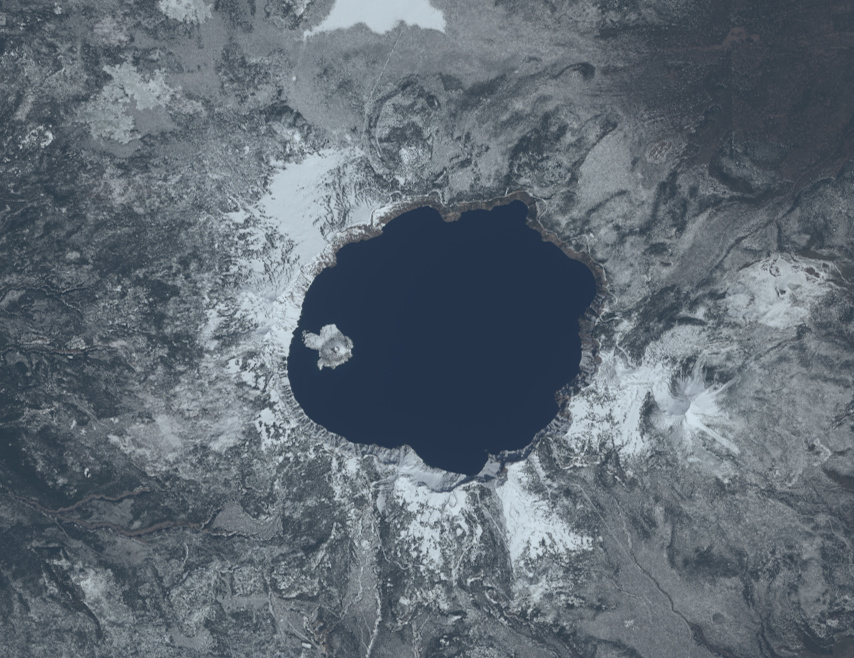
|
|
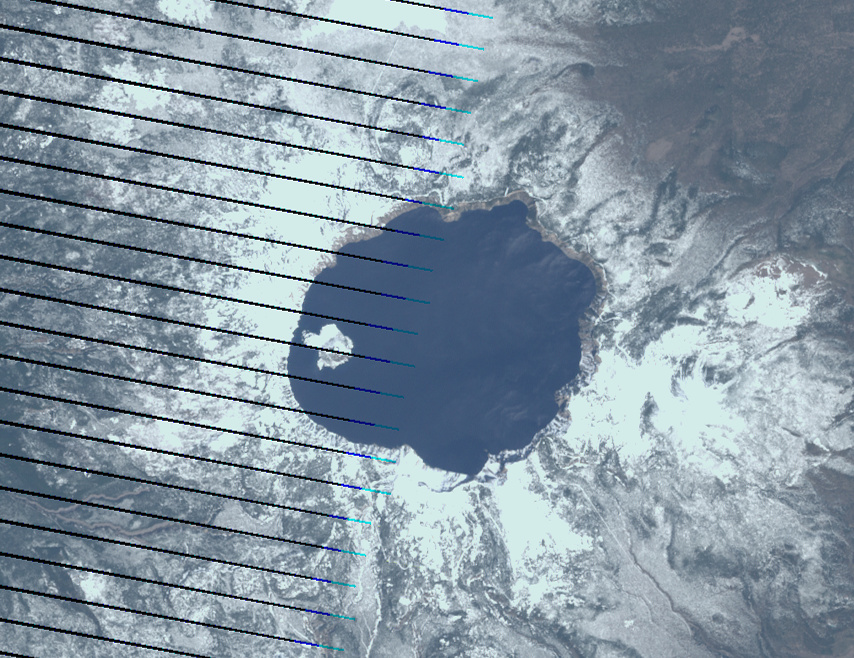
| Landsat 8 crop visual 432 (2013) | Landsat 7 SLC-off crop visual 321 (2013) |
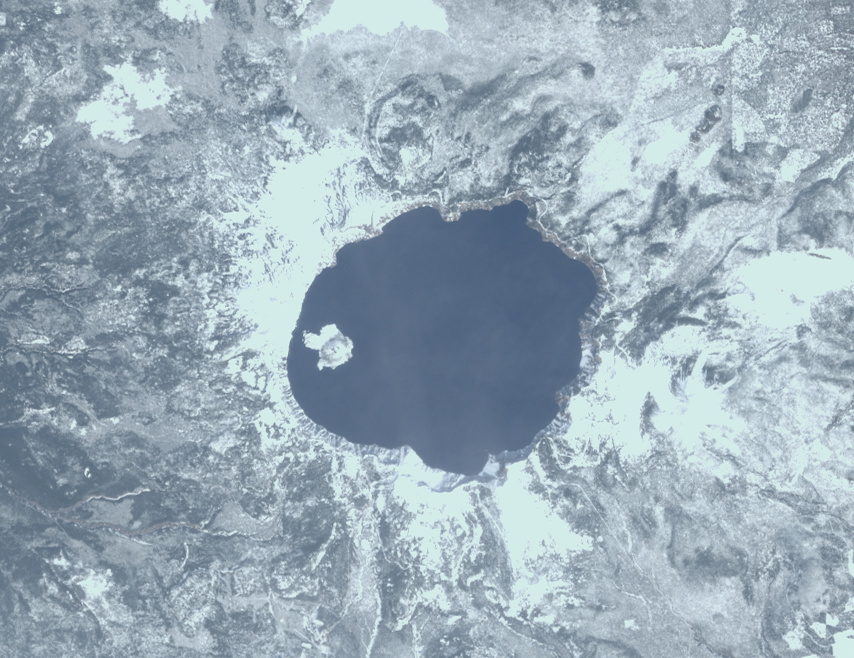
|
|
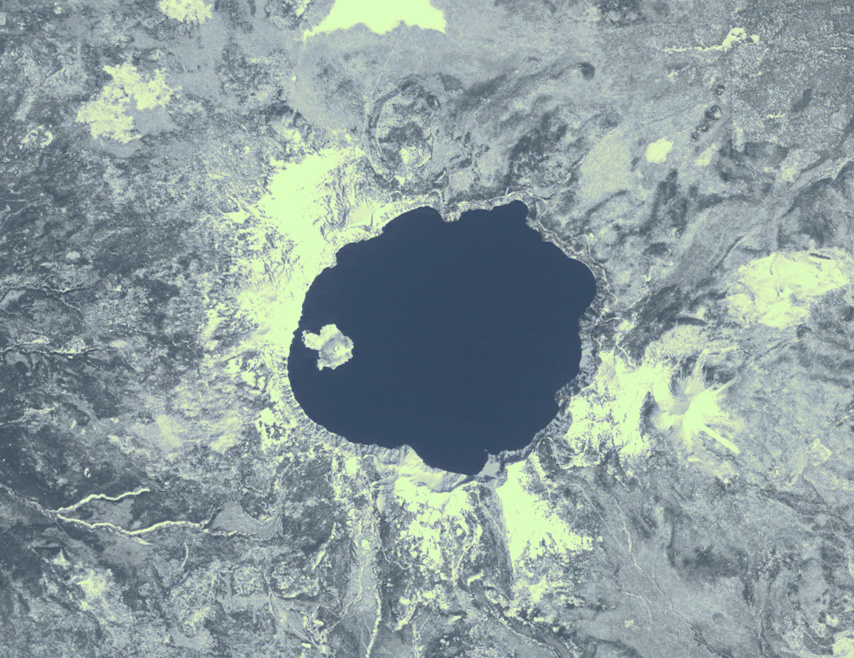
| Landsat 7 SLC-on crop visual 321 (2000) | Landsat 5 crop visual 321 (2011) |
One obvious difference is that bright snow areas are without structure in case of Landsat 7 and 5. These areas are overexposed. Landsat 7 allows adjusting the signal amplification (gain) of the sensor signal before the analog-digital conversion (which is similar to adjusting the sensitivity (ISO) in case of a digital camera). In practical operation this is done based on a set of rules depending on the location of the scene, time of year etc.. The scene here uses a high gain leading to saturation on snow areas. In case of the Landsat 5 image these areas also have a characteristic yellow tint resulting from the different channels clipping at different intensities. One could of course argue that if this occurs so frequently high gain should be used more conservatively but this would diminish quality in the darker areas. The effect described here is the analog-digital conversion limiting the dynamic range of the imaging system. By allowing different amplifications the Landsat 7 system tried to make most use of the limited dynamic range.
The question arising now is if Landsat 7 would have profited from a better AD converter. The answer would probably be yes, but not very much. We can actually get an idea of the amounts of noise by looking at dark areas in the image, like the lake. The Landsat 7 green band has a standard deviation of about 1.8 DN here, for the Landsat 5 image it is 0.7 DN. The difference is due to the actual lake color being less uniform by the way, not the Landsat 5 data being better. On the contrary, the Landsat 5 data is significantly noisier, especially with more pattern noise.
For the Landsat 8 data of the lake in comparison i measured a standard deviation of 25 - but in 16 bit values meaning a dynamic range of at least about 2500:1. Considering the lake is actually quite far from being dark it could well be that Landsat 8 actually makes full use of the 12 bit AD converter.
Considering the large increase in file sizes that comes as a price for this it is frequently asked if this increase in bit depth is actually needed. The example of the lake should already answer this question to some extent: it will allow much better differentiation of tones in dark areas and at the same time avoid overexposed bright areas. How far the higher bit depth is required in the processing pipeline is a different question but the USGS should be commended for not crippling the data they distribute.
The quality assessment data
The QA file included with the Landsat 8 data contains a 16 bit value for every pixel with the following information:
- fill pixel (yes/no) - for pixels outside the scene area
- terrain occlusion (yes/no) - for pixels in high relief areas not visible from the satellite
- water confidence (four levels) - water mask
- vegetation confidence (four levels) - vegetation mask
- snow/ice confidence (four levels) - snow/ice mask
- cirrus confidence (four levels) - cirrus cloud mask
- cloud confidence (four levels) - cloud mask
It is difficult to say something about this from the sample data released till now. It will remain to be seen how well these assessments work in practice. What seems missing is a cloud shadow mask although there are reserved bits probably intended for this.
A few remarks on spatial resolution
The USGS has also been criticized for not increasing the spatial resolution with the new satellite. Of course an increase in resolution per se would be great it would come with a number of side effects:
- Higher spatial resolution would mean larger files and the file size has already been increased a lot. Arguing for a higher spatial resolution instead of additional spectral bands and dynamic range would follow the trend quantity instead of quality that been established by web map services, especially Google Maps, which should be rightfully criticised.
- Even with the current resolution of Landsat the absolute accuracy of the data is still quite low in a many parts of the world due to the lack of reference data to properly align the images. This is no problem in the above example (which probably has a positional accuracy of a few meters) but from my experience with Landsat data in remote regions positional tolerances are often much larger, sometimes up to several hundred meters. This problem will not change in any way with the new satellite and as long as this is not addressed the use of higher resolution information is severely limited.
- The bandwidth of data transfer from the satellite to the ground cannot be easily increased so a higher spatial resolution would at the same time mean less images can be recorded and less area covered during the same period.
To me it seems keeping the resolution at the previous level underlines the goal to map the whole planet in uniform quality rather than just mapping selected areas of interest in high resolution. This is a goal i would very much support.
Christoph Hormann, May 2013

Visitor comments:
By submitting your comment you agree to the privacy policy and agree to the information you provide (except for the email address) to be published on this website.