

Shape from shading 2 - relief information from satellite images and map data
When i previously looked into use of shape-from-shading techniques for improving elevation data focus was mainly on polar regions where both the winter snow cover and the overlap between satellite orbits provided fairly good conditions. One thing that turned out in those experiments was that using map data, in particular on waterbodies, can be very useful as hints for the relief structure. I here look in more detail how this can be used outside polar regions to improve elevation data.
Conditions outside polar regions are more difficult with regards to shading information in satellite images in two ways:
- There is usually no continuous snow cover over larger areas at any time of the year. The actual surface color varies strongly both spatially and temporarily.
- The satellite orbits do not overlap much meaning images are all from the same time of the day and illumination direction varies mostly in elevation but only very little in azimuth direction.
As a result there is nearly no possibility for combined use of multiple images to derive the shape and in individual images it is difficult to separate intrinsic from illumination based differences.
Statistical shape from shading
On the bright side availability of satellite images outside polar regions is generally much better, there are more images available and in better quality. This can be used to tackle the temporal variability in the earth surface appearance in some way. So using a number of satellite images you can at least derive some hints on the relief from those that can be useful for improving elevation data.
What works particularly well is detecting ridges in the terrain this way. The rough location of larger ridges is already clear from the original low resolution elevation data. Depending on their orientation ridges generate a contrast between bright color on the side facing the sun and darker color on the opposite side. This can be used to more accurately locate the ridge.
The problem with this is that with all satellite images featuring roughly the same lighting direction the ridges in southwest-northeast direction are much better visible than the ones in northwest-southeast direction. This preference will show up as anisotropy in the additional details provided.
Using OpenStreetMap data
In my previous use of shape-from-shading i already made use of waterbody data to supplement the shading information. The advantage there was the data was of uniform quality without gaps and larger inaccuracy. Generally waterbody data in OpenStreetMap is of varying and often poor quality. In addition to waterbodies there is a lot of other data in OpenStreetMap that is potentially useful for deriving relief information.
- peaks (natural=peak) - this is the most obvious. Problems apart from inaccuracies in placement of the peaks are the lack of elevation information and unknown reference system for the elevation values.
- ridges and cliffs (natural=ridge and natural=cliff) - obviously these could be useful, these are however more tricky. Only natural=cliff is rendered in the standard map style meaning natural=ridge is rarely mapped and natural=cliff is frequently abused instead of it. Also placement of these features is frequently quite inaccurate.
- roads provide relief information in two ways: they are usually not significantly inclined from one side to the other and they are fairly smooth along their course.
- Certain features, in particular aeroway=*, can be assumed to be nearly level.
- Additional information on tunnels and bridges can be used to derive local relative elevation differences.
- Any feature with elevation information ele=* - provided this information is accurate.
The elements i actually used in the following examples are the waterbodies (coastlines, lakes and river lines - riverbank polygons are currently not processed), peaks and roads. Roads are really only useful with fairly high resolution elevation data so here i tuned down their influence to be only marginally visible. Lakes are essentially flattened as i previously demonstrated. Rivers are a bit more complex, especially if they are not continuously mapped or contain tunnel sections. The assumptions i make are that they have a smooth profile (using data of waterfalls and rapids as hints for discontinuities in the profile would be good but those are not broadly mapped in the sample areas) and that the original elevation data generally overestimates elevation at the rivers. The latter is a safe assumption for SRTM data but can be different for other base data sets. Likewise it is assumed peaks are underestimated in elevation (unless of course elevation information is in the data).
Examples
Bernese Alps
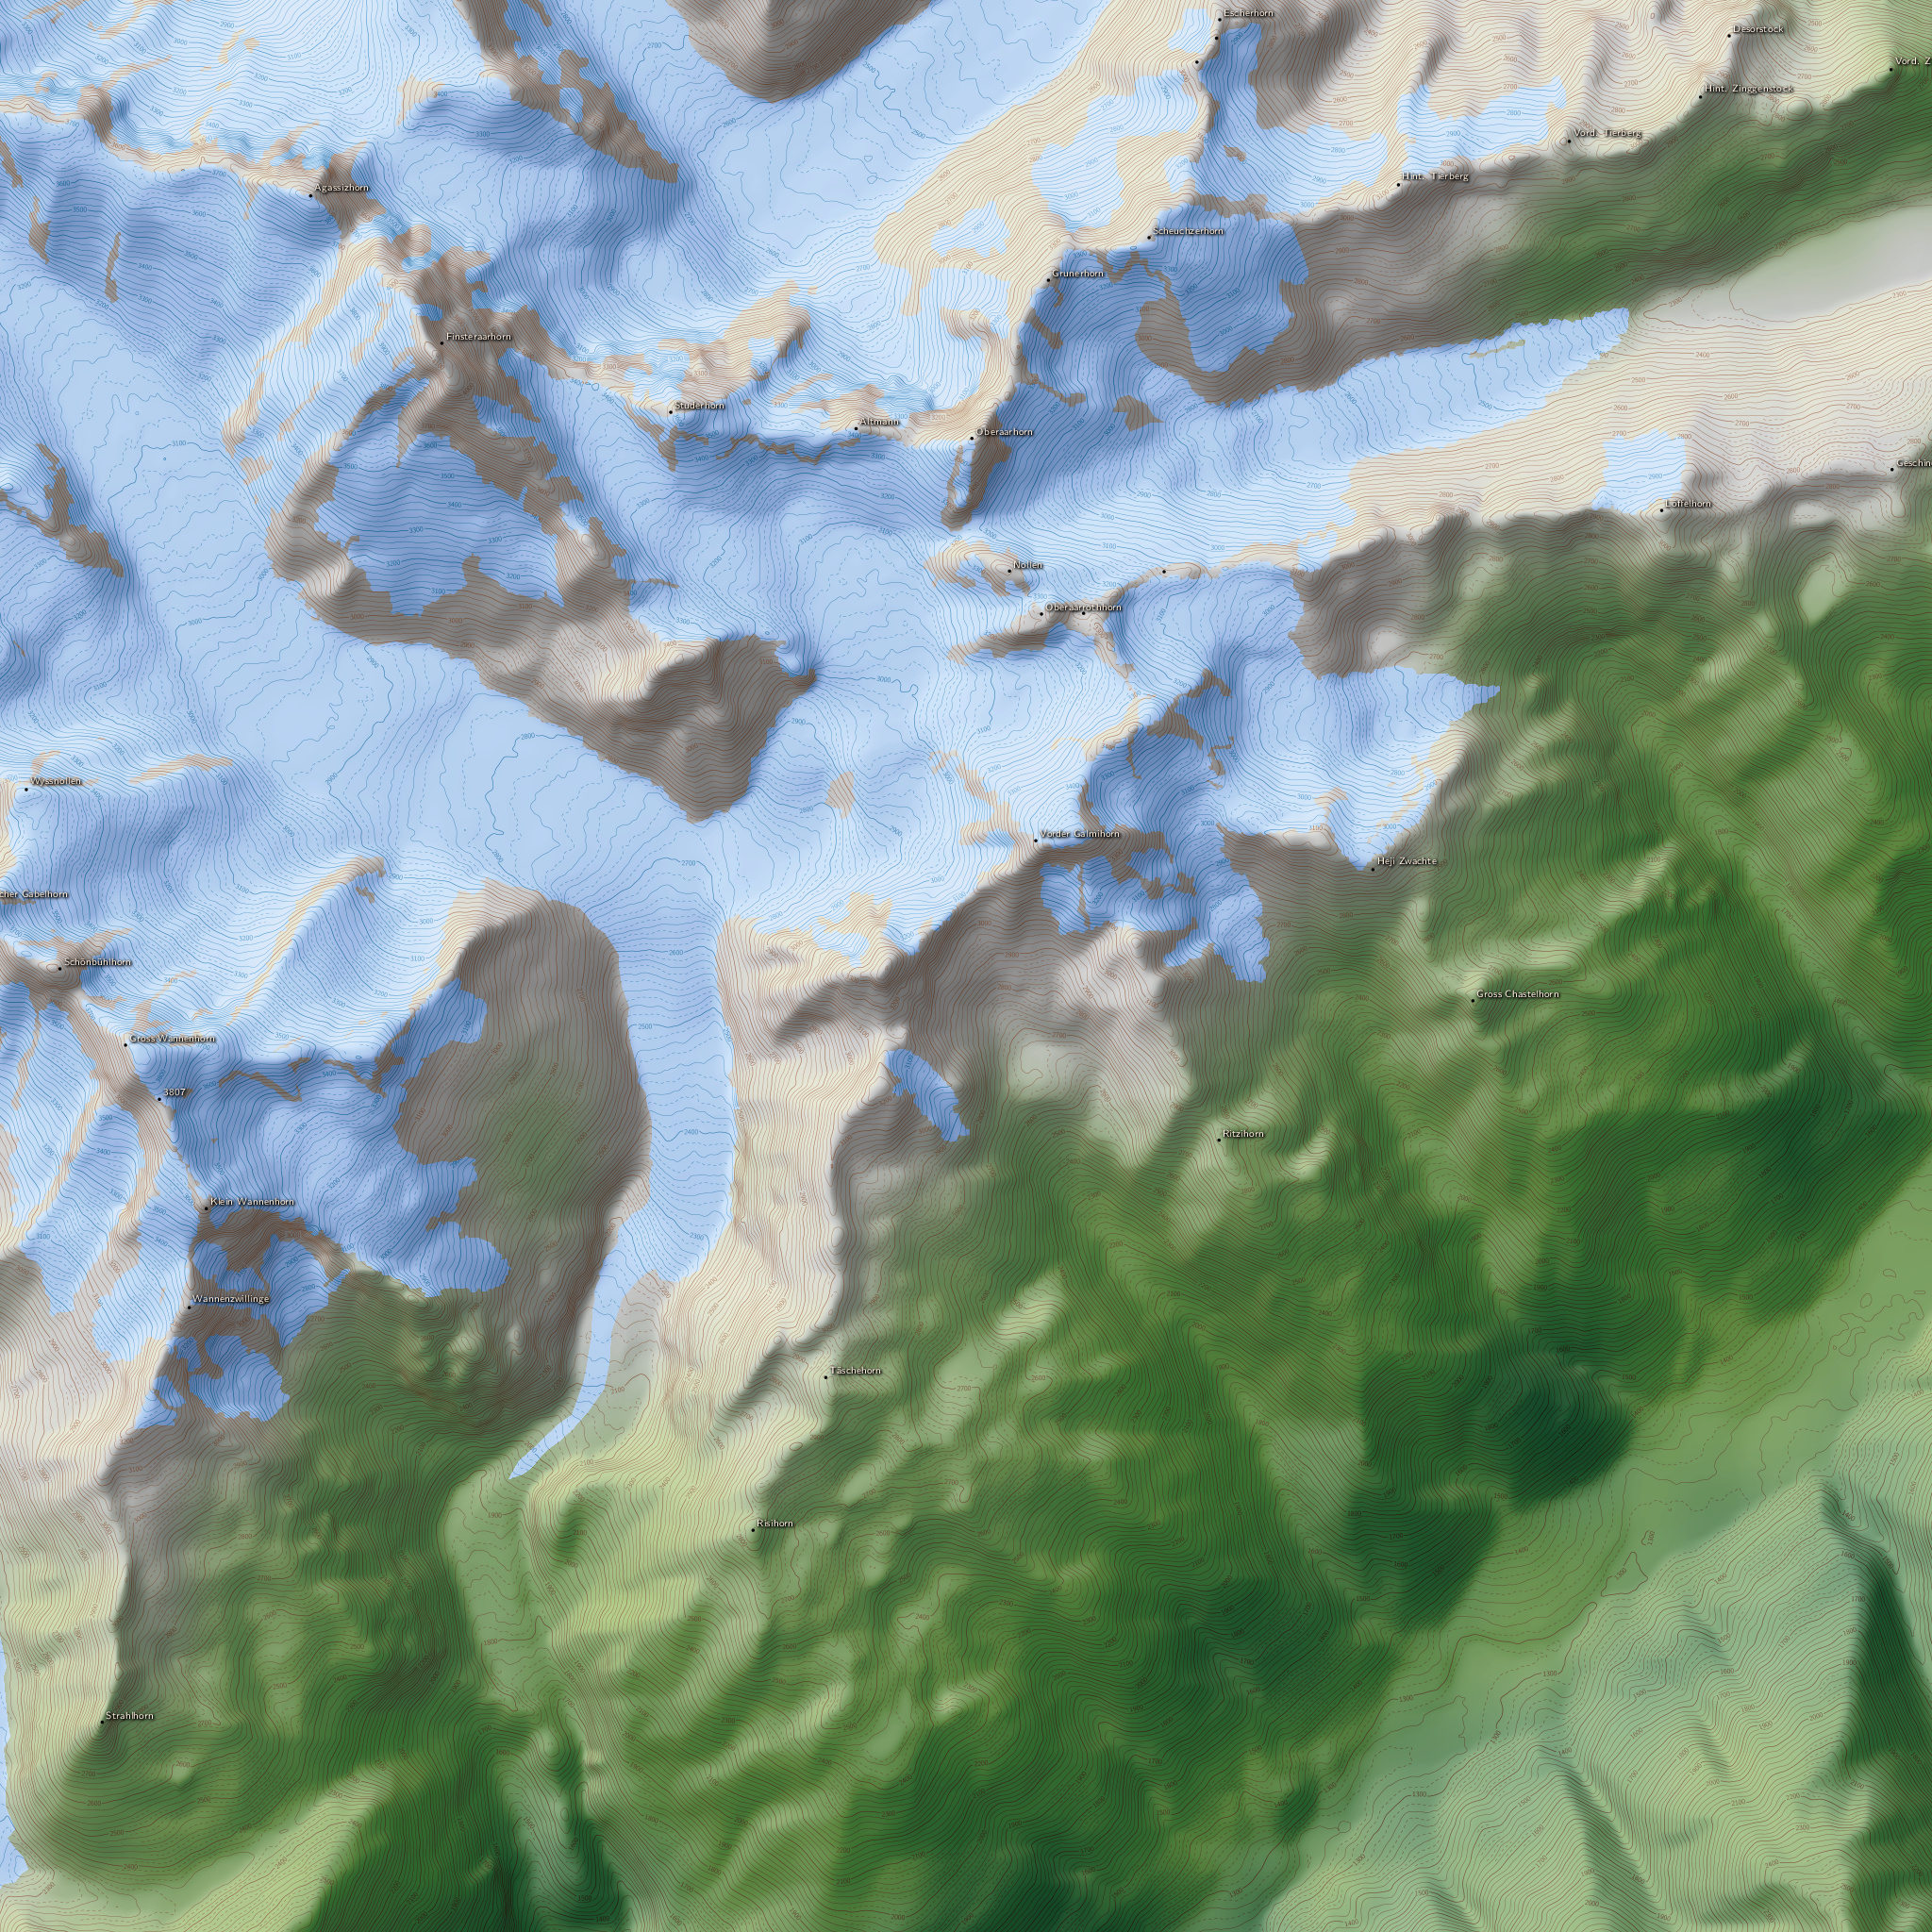
The first sample area i used is in the Swiss Alps in the eastern Bernese Alps. The area is characterized by some permanent as well as seasonal snow cover and fairly strong relief in quite variable forms. Peaks are fairly well mapped in OpenStreetMap here including elevation values. Lakes are also well mapped but rivers and streams are quite incomplete.
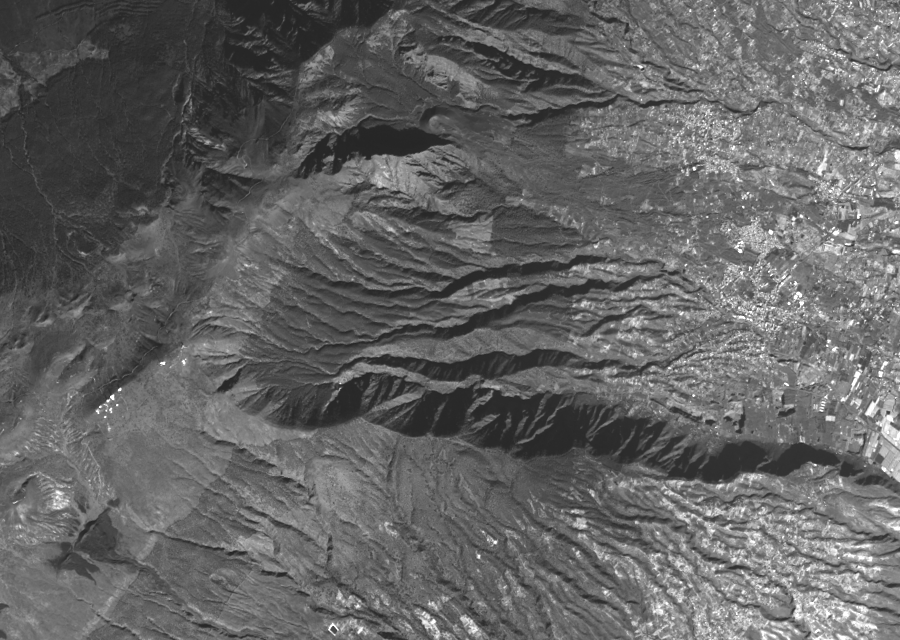
I used a total of seven Landsat images for shading information - some with significant cloud cover though. Based on the resolution of the Landsat images processing is done on a 15 meters grid.
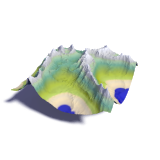
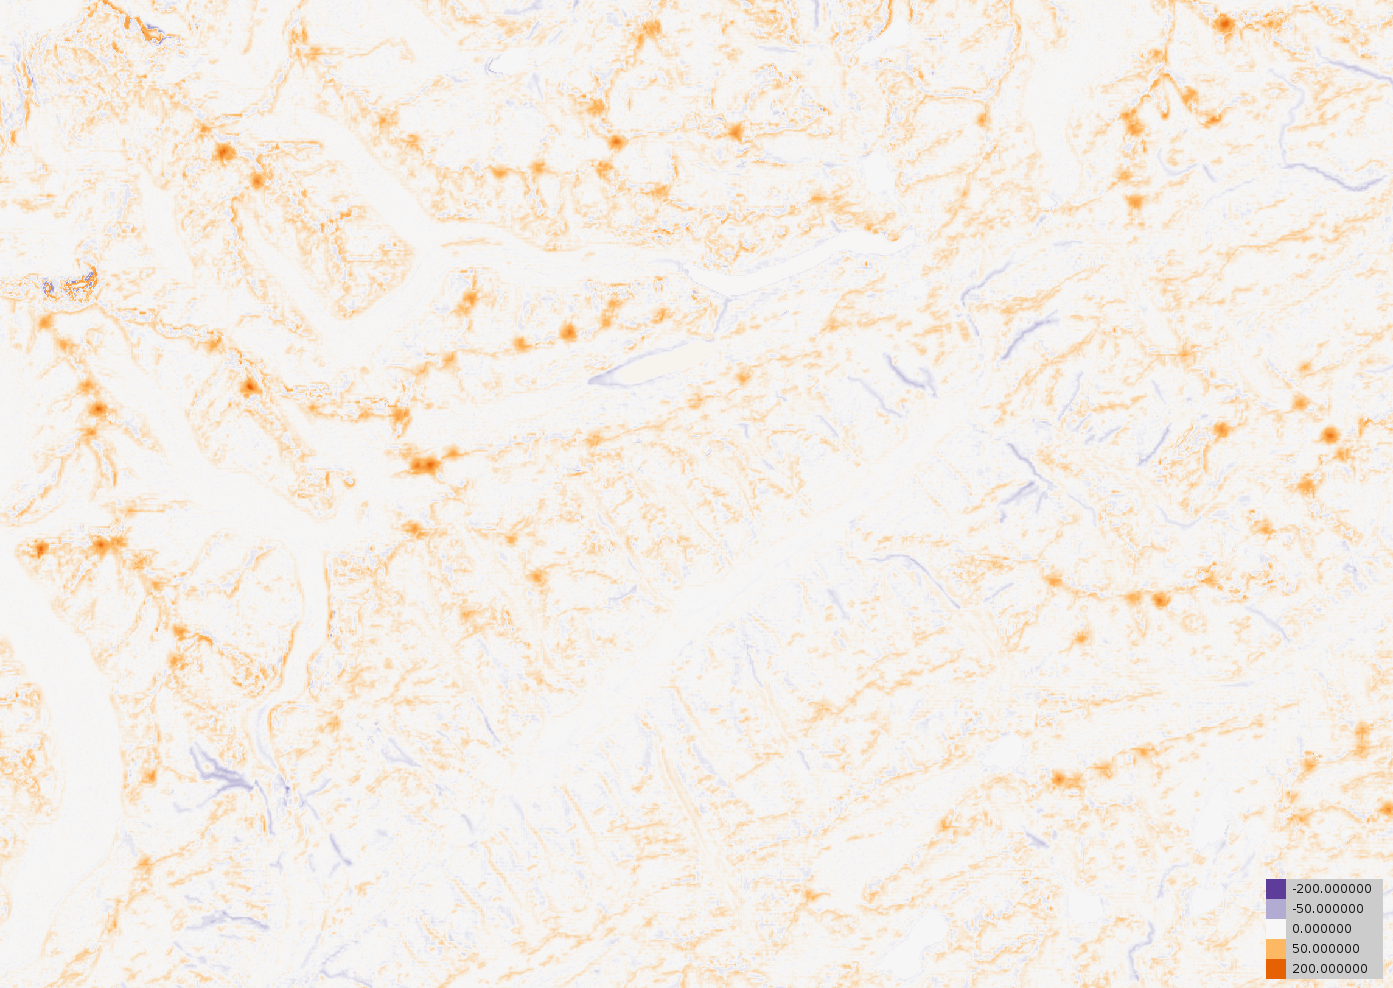
The base elevation data used is a merge of SRTM and ASTER GDEM data with the lakes already flattened - you can see the shaded rendering and the OpenStreetMap data used below. I used southwest illumination in the shading to better work out the anisotropy in the detail added from the satellite images.
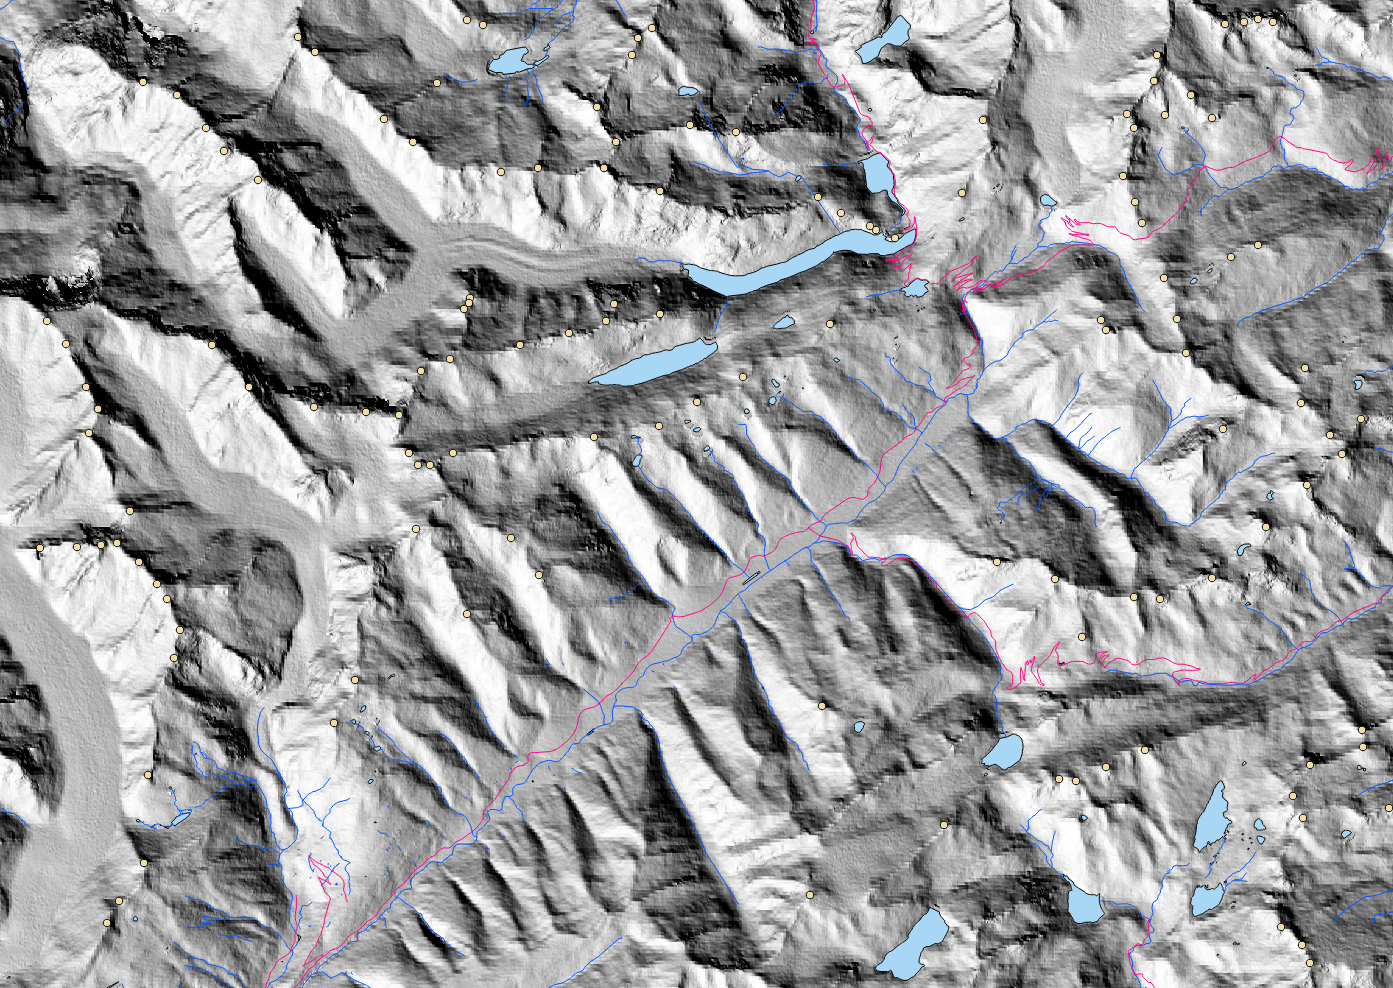
|
|
|
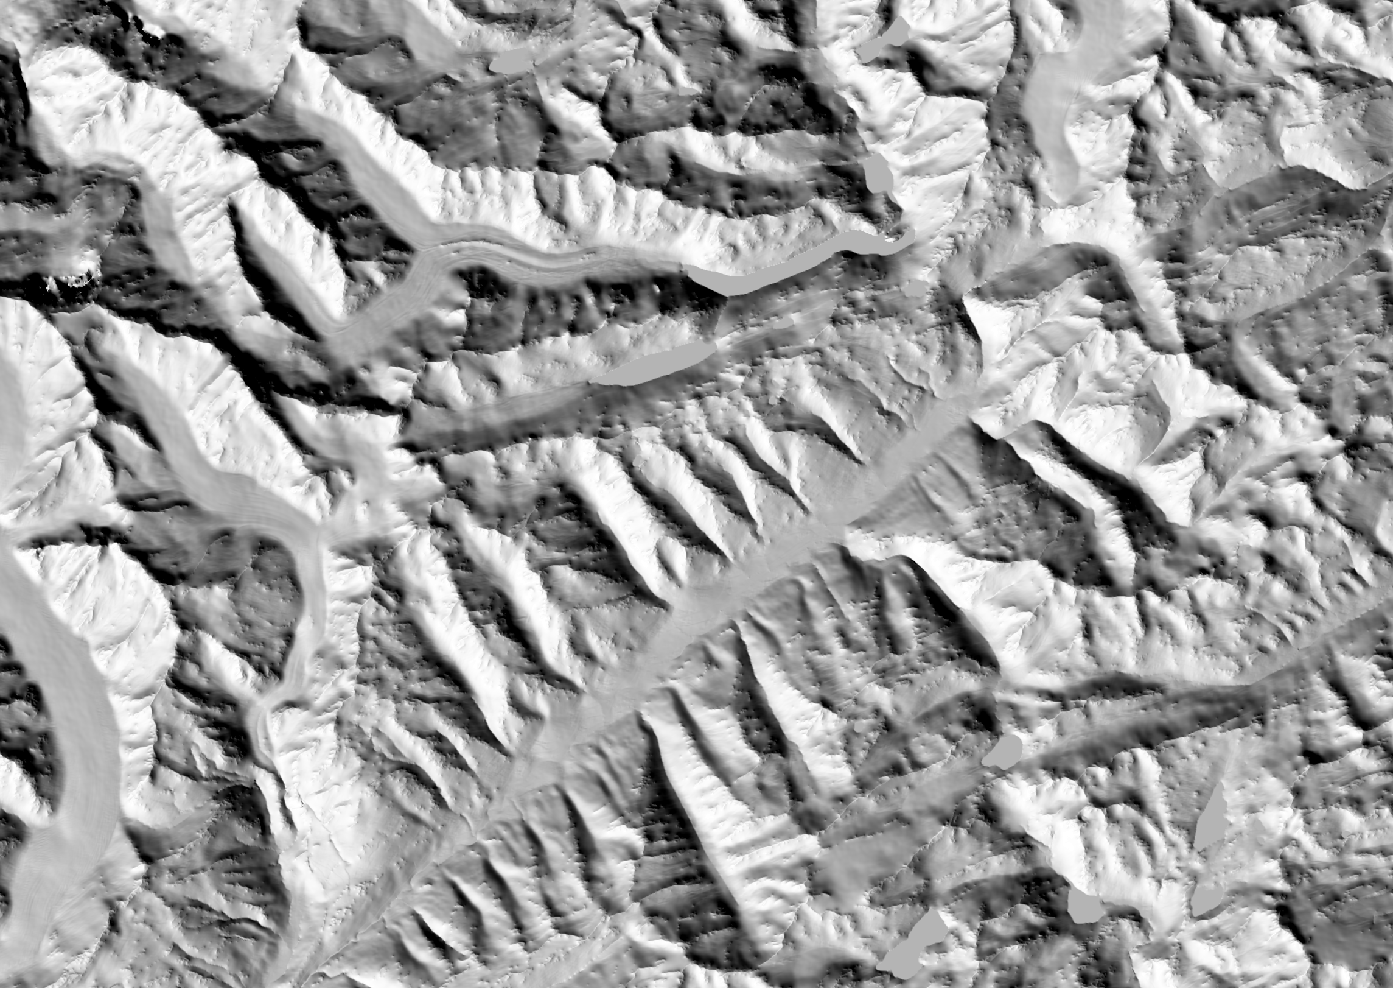
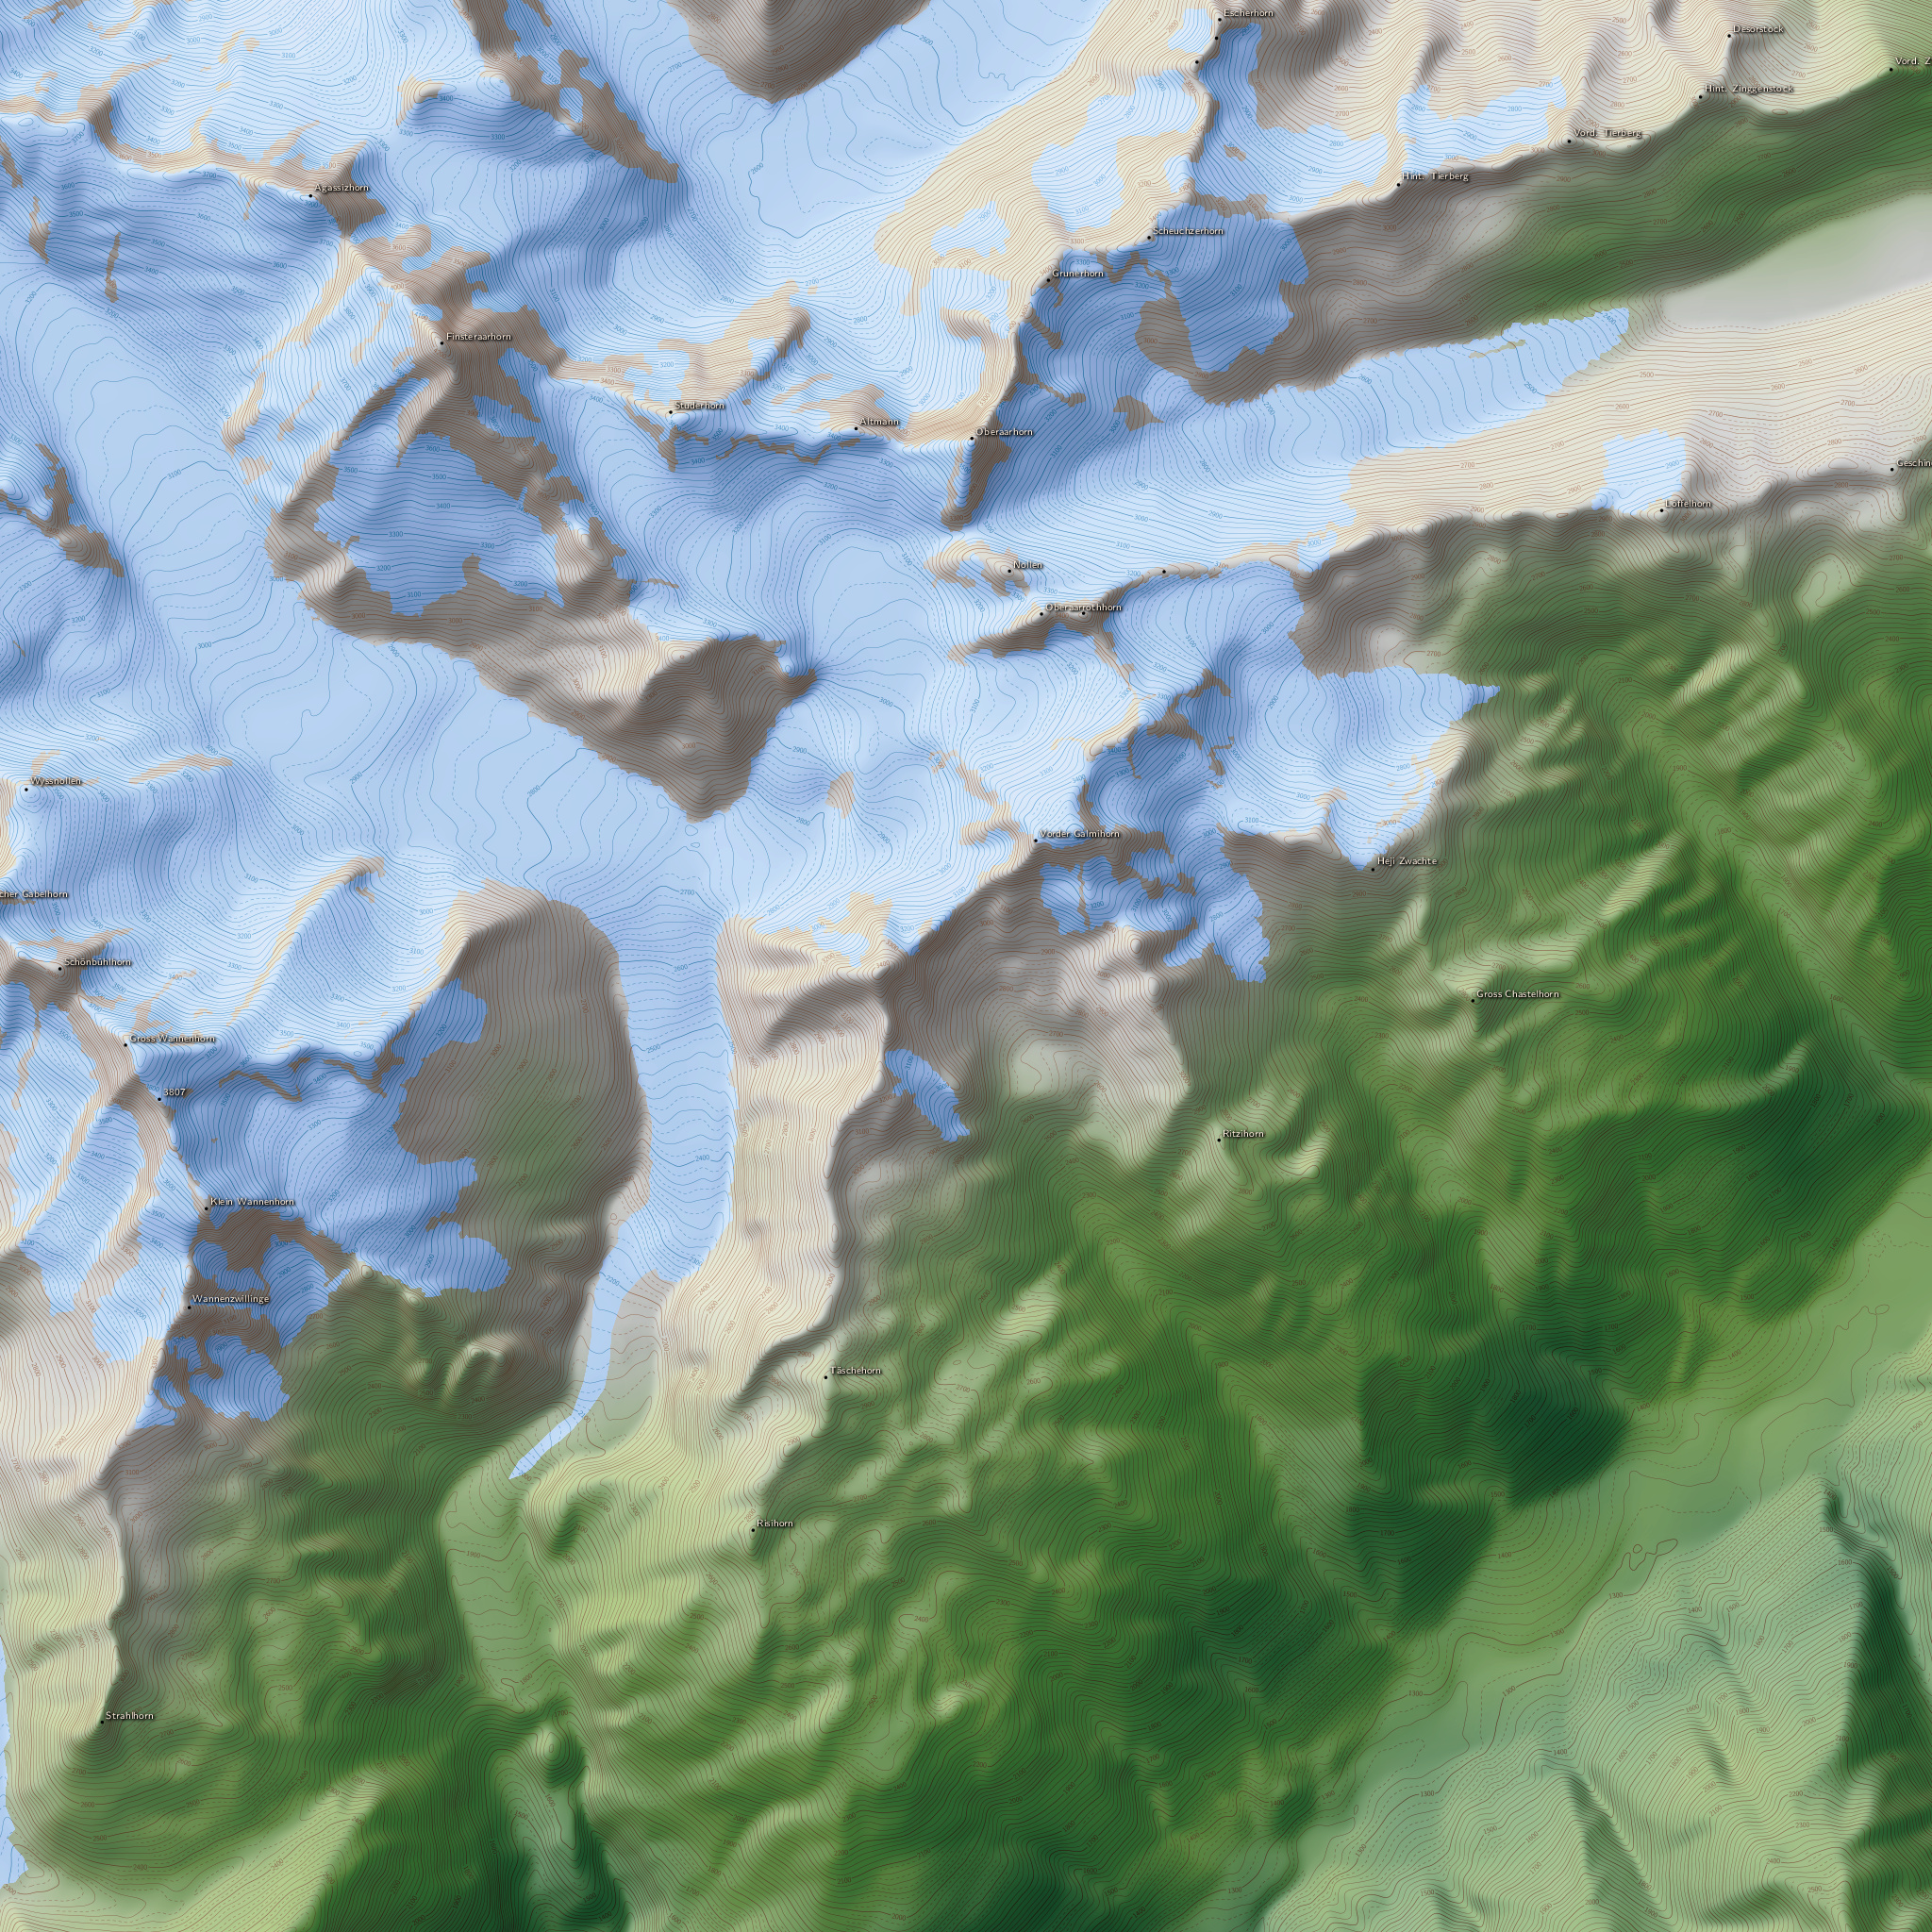
| OpenStreetMap data used and original relief | Improved elevation data shading | Difference between improved and original DEM |
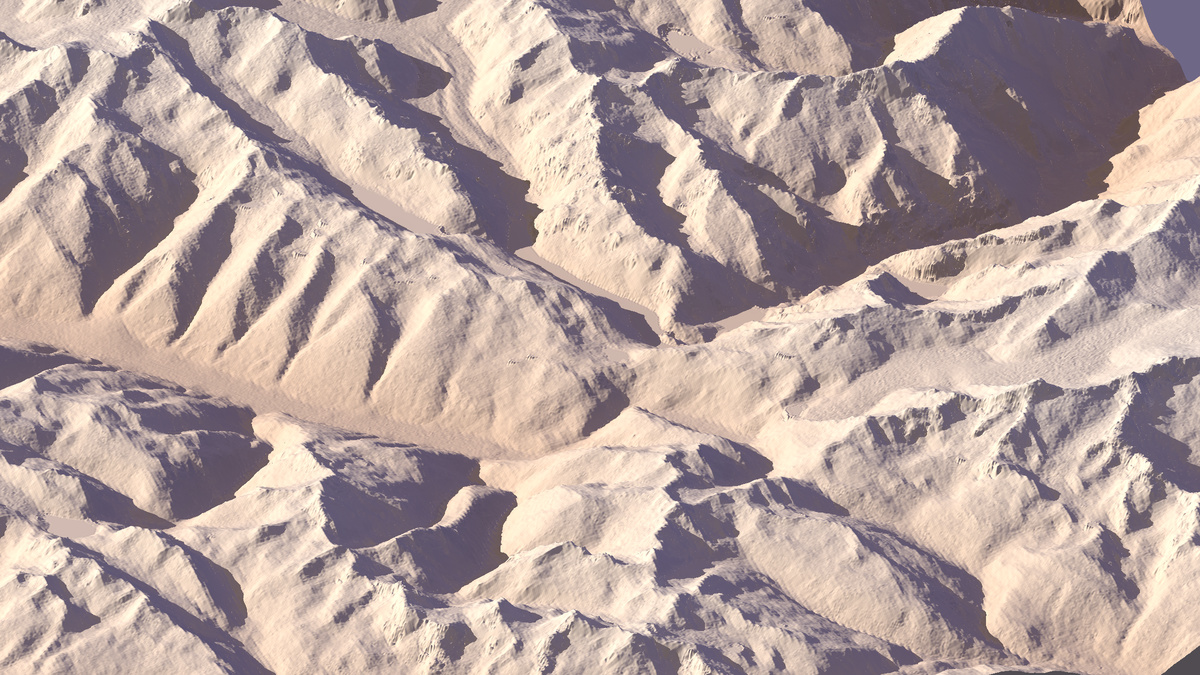
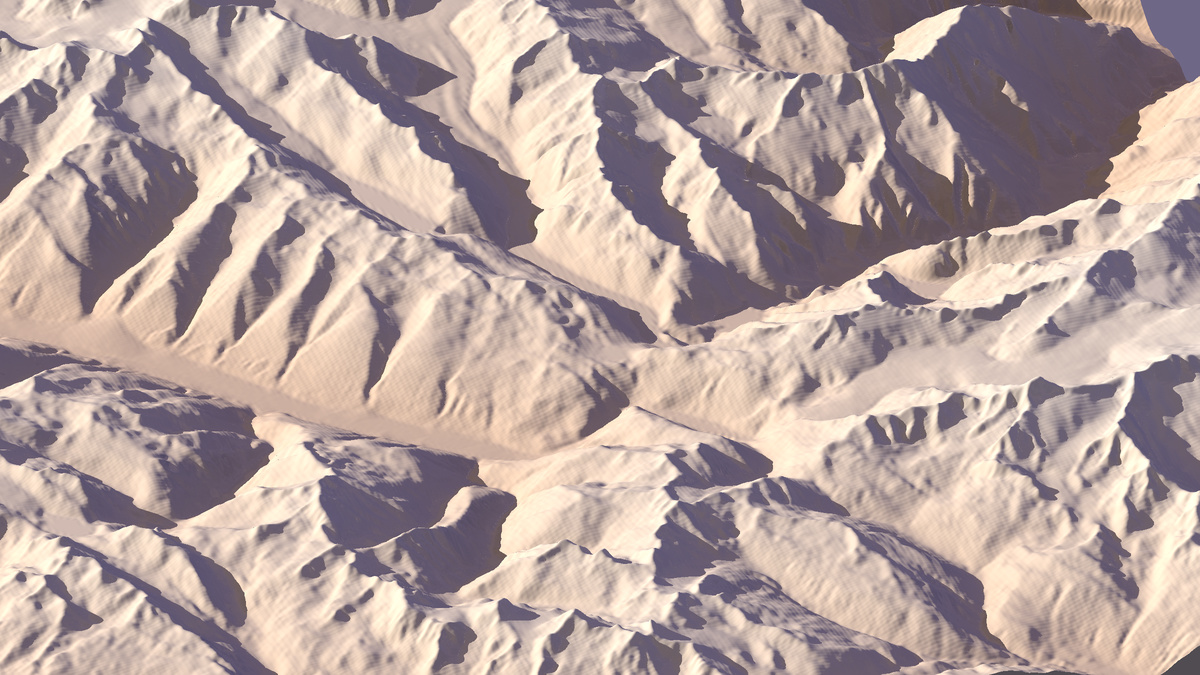
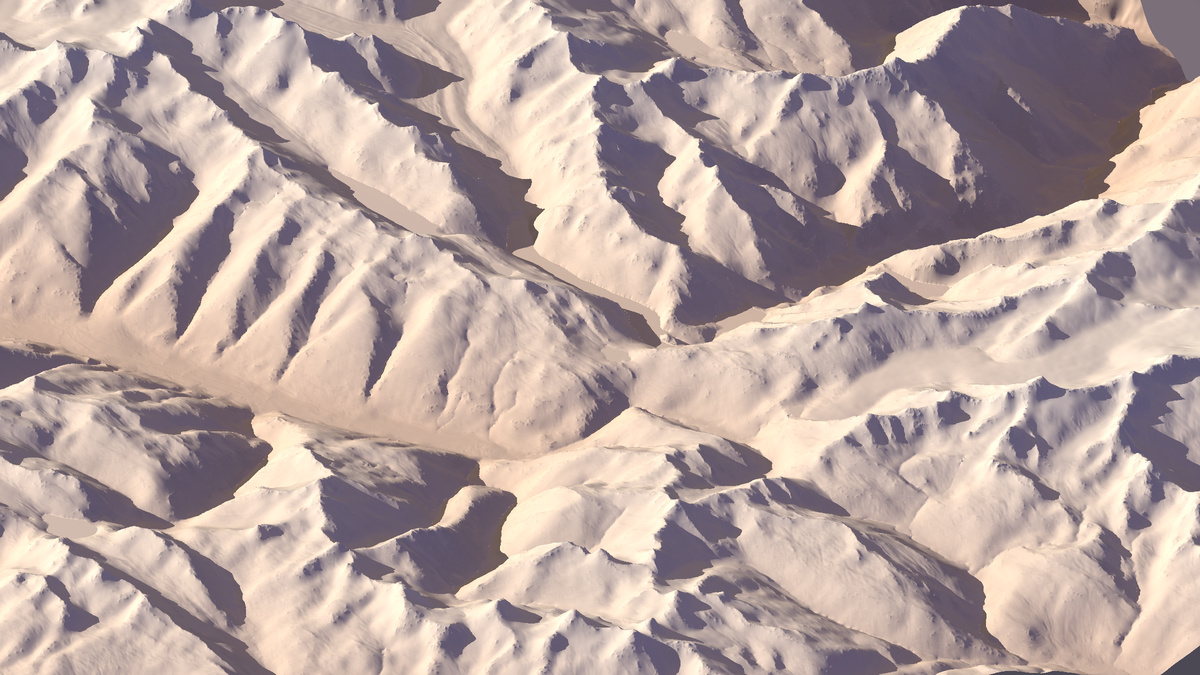
The difference image shows a systematic increase in elevation. This is mostly due to the few river mapped on one hand and the extensive mapping of peaks on the other hand. The additional detail is better visible in 3d renders - here a comparison including Jonathan de Ferranti's 1 arc second data which offers significantly more detail than the SRTM data but is somewhat outdated in particular in the areas of the glaciers.
|
|
|
| Original relief data | viewfinderpanoramas.org 1 second data | Improved relief |
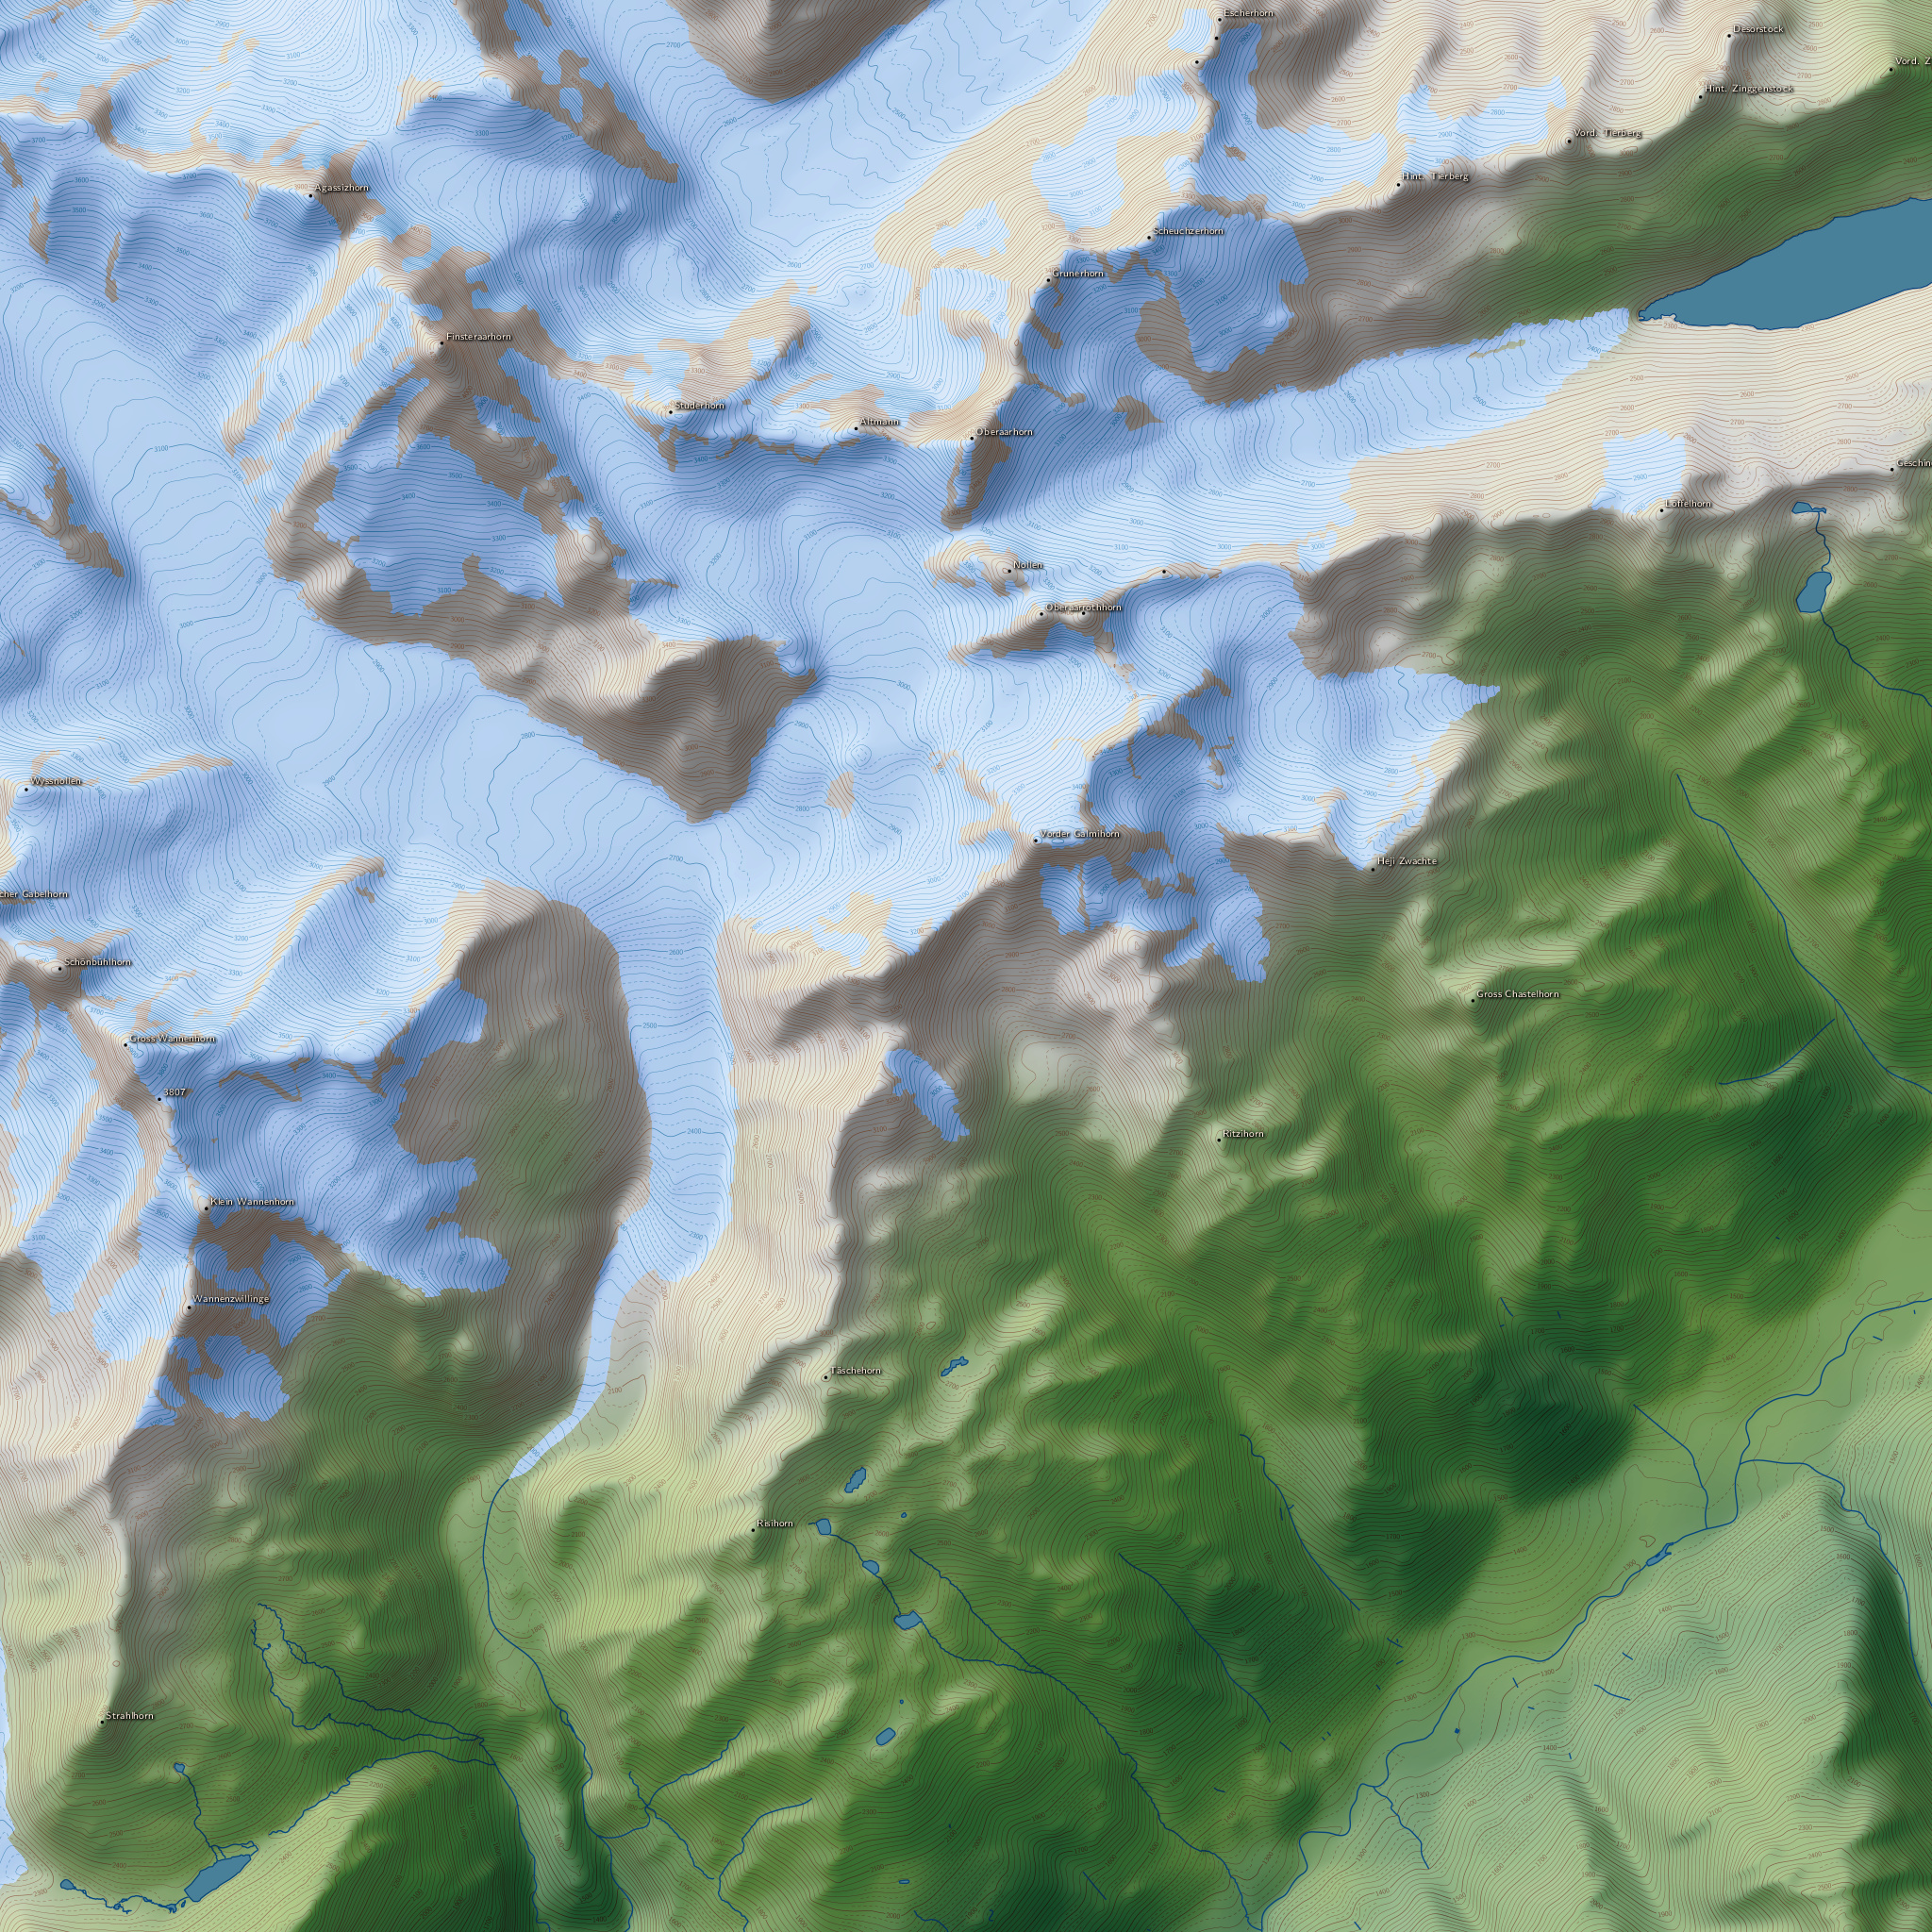
The lower resolution data renderings show some grid artefacts due to less than optimal interpolation which should be ignored. Comparison shows there is a bit of detail loss from the original data in processing but most of this is just noise and no real information anyway. The 1 second map derived data has some lead in intermediate detail, especially in case of structures with unfavorable orientation towards the sun. In general 3d renderings are a very grateful application here since the fine detail added is well visible and possible errors in absolute elevation do not really show up. Lets look at a classical map view with contour lines for a different perspective. Waterbodies are only rendered in the improved version. For comparison the same area in Map Compare with the Bing and Google images and in maps with relief rendering.
|
|
|
| Original relief data | viewfinderpanoramas.org 1 second data | Improved relief |
There are a number of things visible in here:
- The noise in the original DEM resulting in random perturbations of the contours.
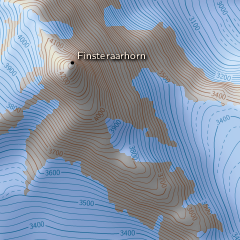
- How the peaks better match the elevation data after processing, especially visible at the Finsteraarhorn where there is a significant mismatch in the original data.
- At the Finsteraarhorn you can also see that the northwest-southeast ridge is quite poorly represented in the improved version due to its orientation, slightly worse even than the original data. Ridges with more favorable orientation are comparable to or even better than in the 1 second data.
- Flattening of lakes and carving of rivers.
- Some inaccurate mapping of rivers resulting in wrong modification of the relief.
- Additional relief details like moraine ridges on the Finsteraargletscher.
|
|
|
| Finsteraarhorn peak modification and poor articulation of the ridge | Finsteraargletscher moraine ridges | Waterbody flattening |
Tenerife
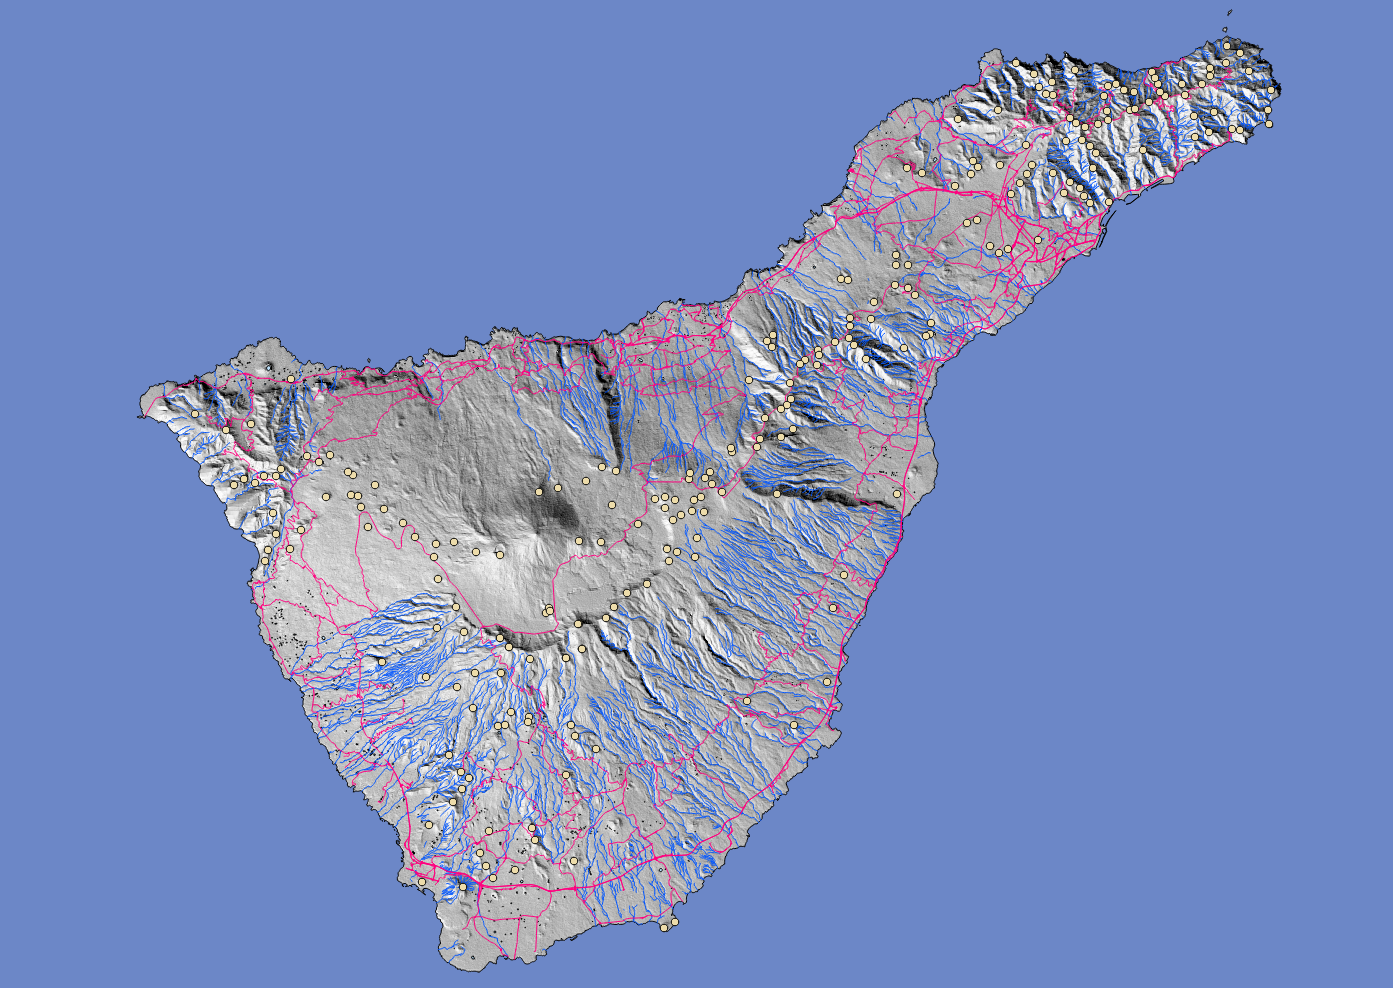
The second sample area is the island of Tenerife in the Atlantic Ocean. This island features strong relief as well, particularly with many deep canyons and some winter snowfall on the highest parts. Mapping of rivers is very good in OpenStreetMap, often actually a bit too detailed for a 15 meter grid. Mapping of peaks on the other hand is incomplete and usually without elevation values. Lakes are only few and small.
The island requires two Landsat scenes for complete coverage so i used a total of 12 images, all matching pairs along the same path so essentially six different images.
|
|
|
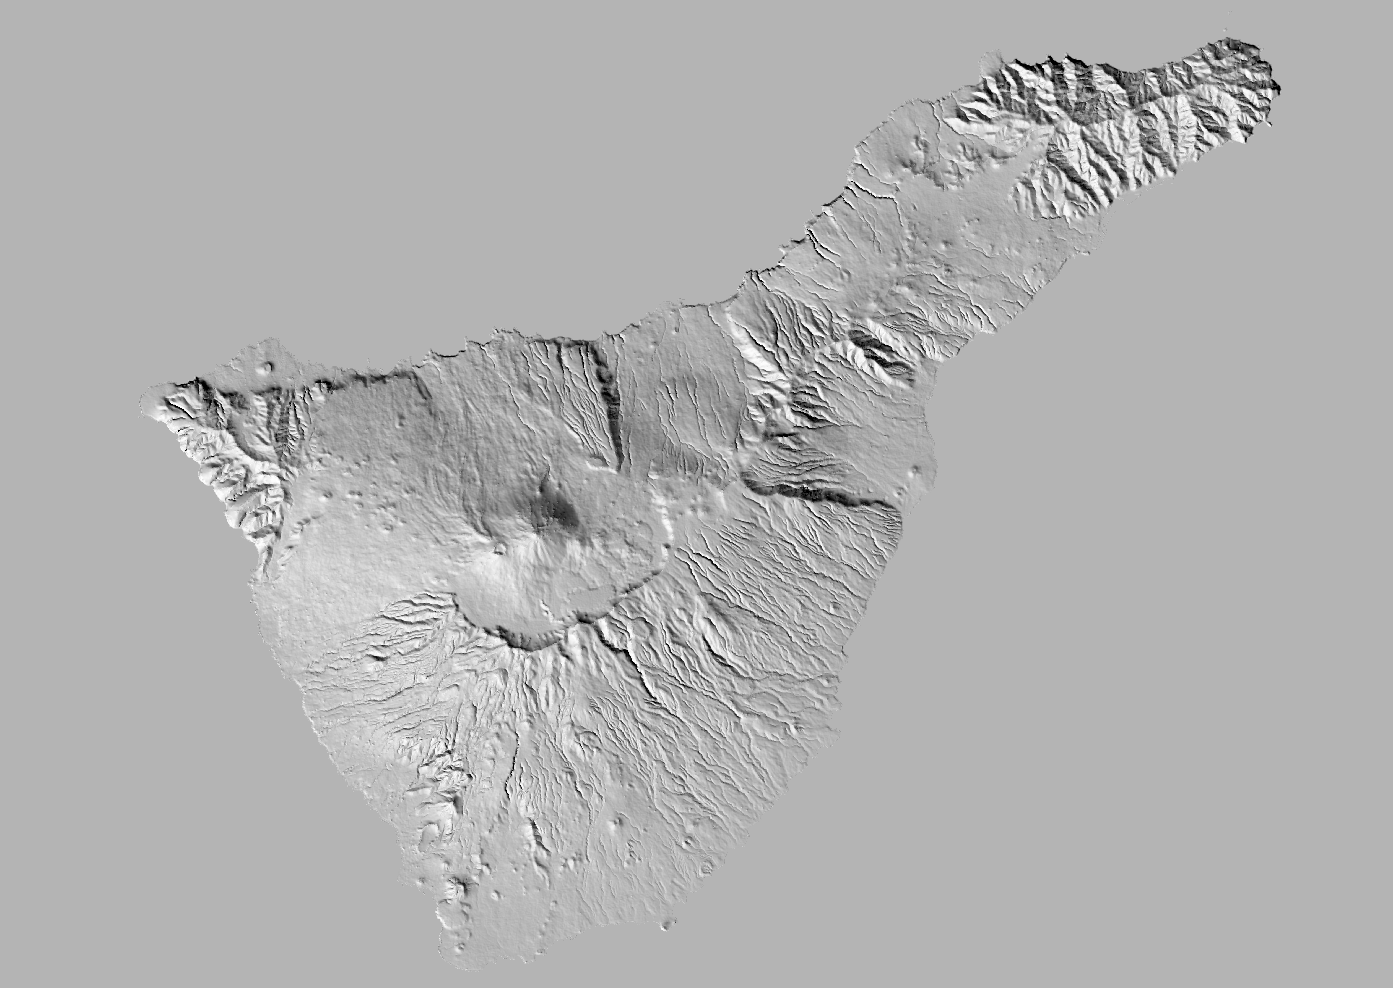
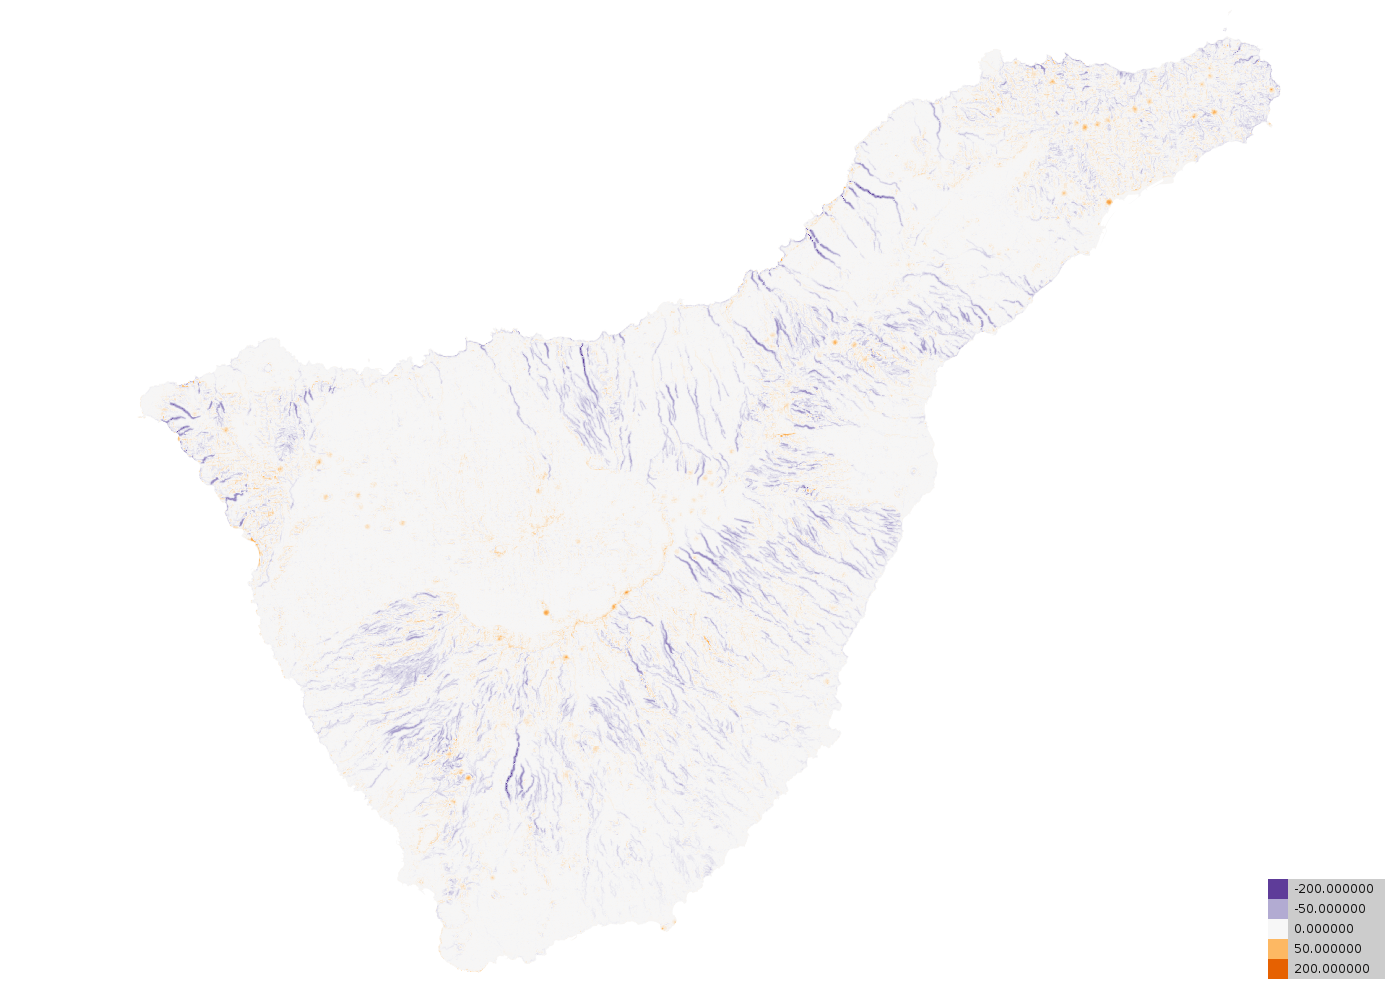
| OpenStreetMap data used and original relief | Improved elevation data shading | Difference between improved and original DEM |
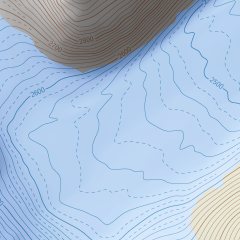
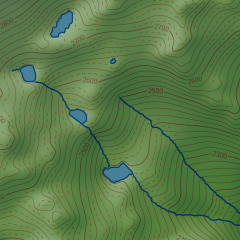
Here the elevation is systematically reduced due to the detailed coverage of rivers. I want to look in particular at the steep coast in the northwestern part, the Acantilados de Los Gigantes. The following image shows the map rendering based on the improved elevation data. For comparison the normal relief renderings of the area (including Google which has more detailed data here).
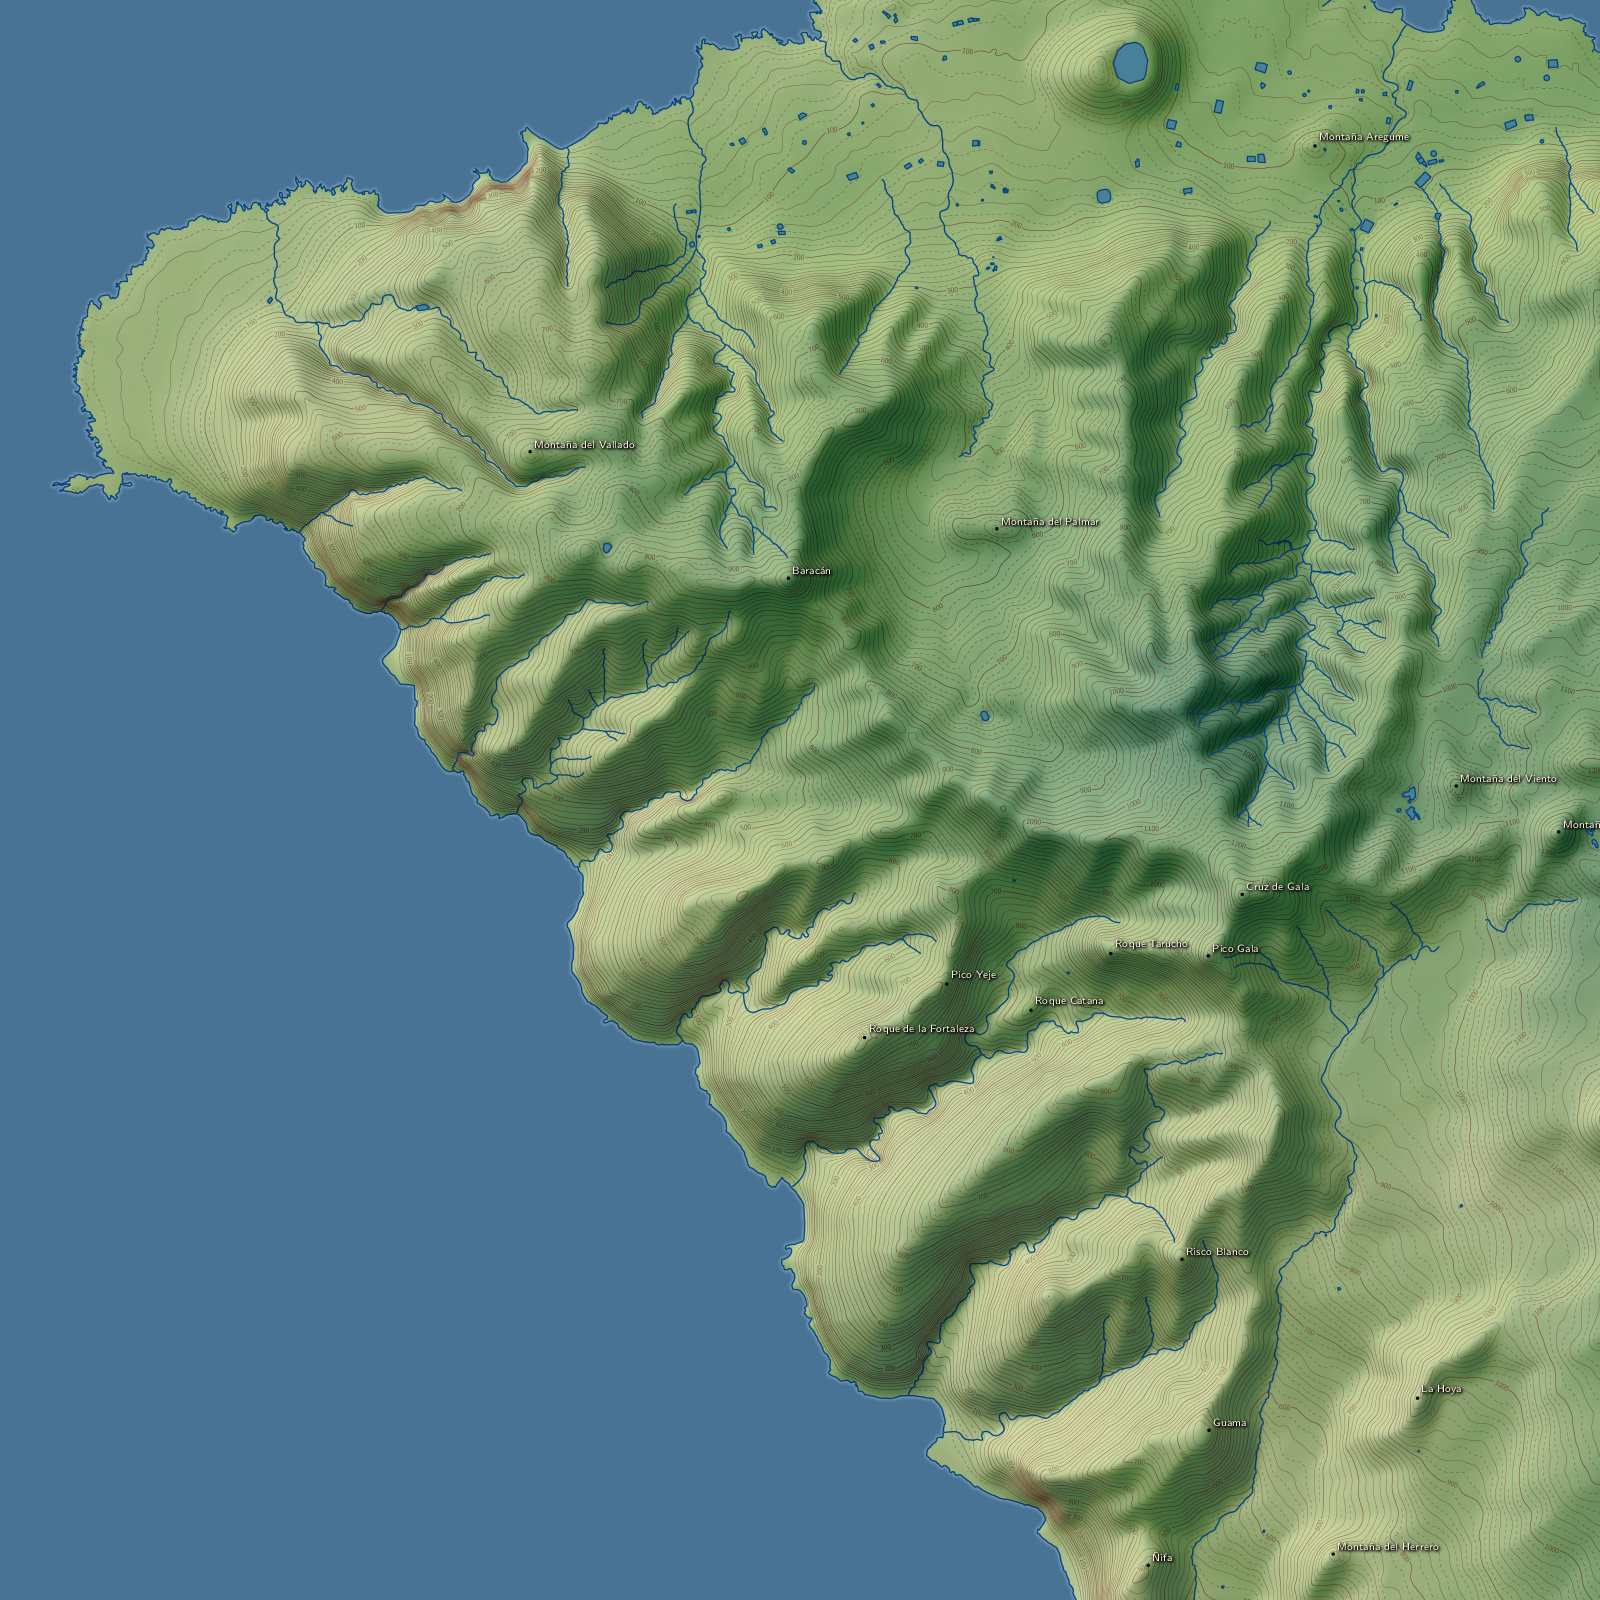
The canyons are not very well defined in the SRTM/ASTER data as can be seen in the Cyclemap. The waterway data helps to improve that although some of the tiny bends in the waterway courses are not properly represented in the 15 meter grid. Also some of the rivers have a very non-uniform profile in reality with steeper and flatter parts which is not known to the processing algorithm and therefore not taken into account. This is for example visible in the northwest of the area south of the Montana del Vallado where the Barranco de las Cuevas is carved into what is in reality a fairly flat plateau.
Conclusion
Using the rivers from OpenStreetMap to improve elevation data works astonishingly well even without full knowledge of the river network structure. The resulting elevation model is of course not guaranteed to be hydrologically sound. The use of satellite images to detect ridges in the terrain and emphasize them in the elevation data depends much on the images used - i have not fully worked this out yet with only these two sample areas so far. These sample areas are both temperate regions with strong and clearly structured relief. Other kinds of regions like flatter and dry, desert like areas could be more difficult. In general the results depend much on the quality of the map data, especially positional accuracy of waterbodies and peaks. With an elevation grid resolution of 15 meters the demands on that are fairly high.
Having more and better relief related map data like cliffs and ridges available would be useful for this kind of processing. This also applies for information on river profile discontinuities like waterfalls. Accurate point elevations of critical locations other than peaks would help too of course.
All of this cannot perform miracles of course, the details added to elevation data this way cannot replace truly measured elevation information. But even beyond the question of detail synchronizing the elevation information with the other map data, especially the waterbodies, is important for a well readable map. This part of the processing described here will be useful even in areas where more detailed elevation data is available.
Christoph Hormann, August 2014
Visitor comments:
no comments yet.
By submitting your comment you agree to the privacy policy and agree to the information you provide (except for the email address) to be published on this website.