

Evaluating void filling data for SRTM DEMs
In 2002 the ![]() NASA
and
NASA
and ![]() USGS released a global data set of the earth surface
geometry in 3 arc second (90m) resolution obtained during a Space Shuttle mission in 2000.
Unfortunately this data set contains significant gaps in the coverage.
USGS released a global data set of the earth surface
geometry in 3 arc second (90m) resolution obtained during a Space Shuttle mission in 2000.
Unfortunately this data set contains significant gaps in the coverage.
Update: as of August 2006 a lot of additional areas have been fixed, especially
in the himalayan region. See the coverage map below or an
![]() up-to-date interactive map
on the Viewfinder Panoramas site.
up-to-date interactive map
on the Viewfinder Panoramas site.
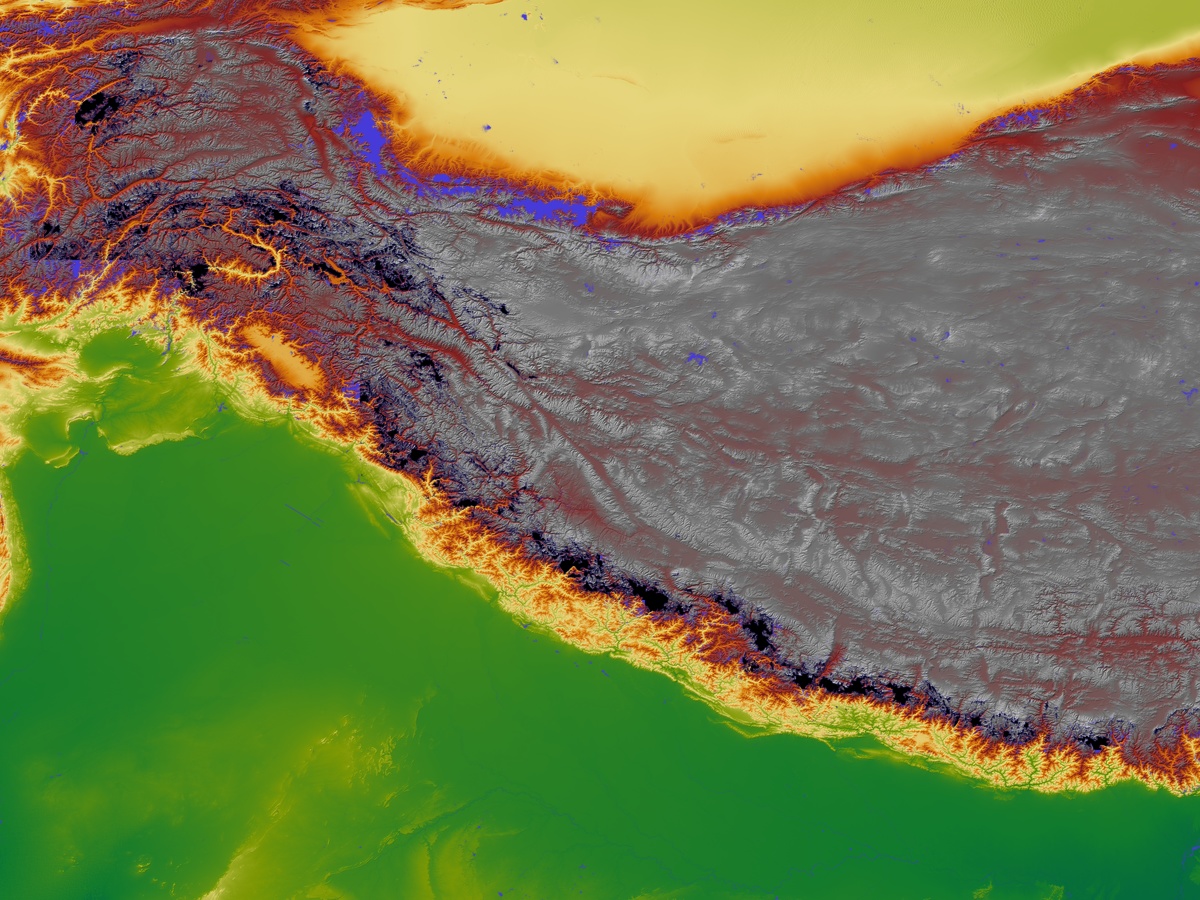
The gaps occur in various places, most often in areas where:
- Data has only been recorded one or very few times which is mostly the case in regions near the equator - see
the
 coverage map.
 - Places where the surface material apparently results in very low radar reflectance. This seems to be especially the case in sand deserts.
- Water surfaces.
- Areas with steep slopes like high mountain regions and deep valleys.
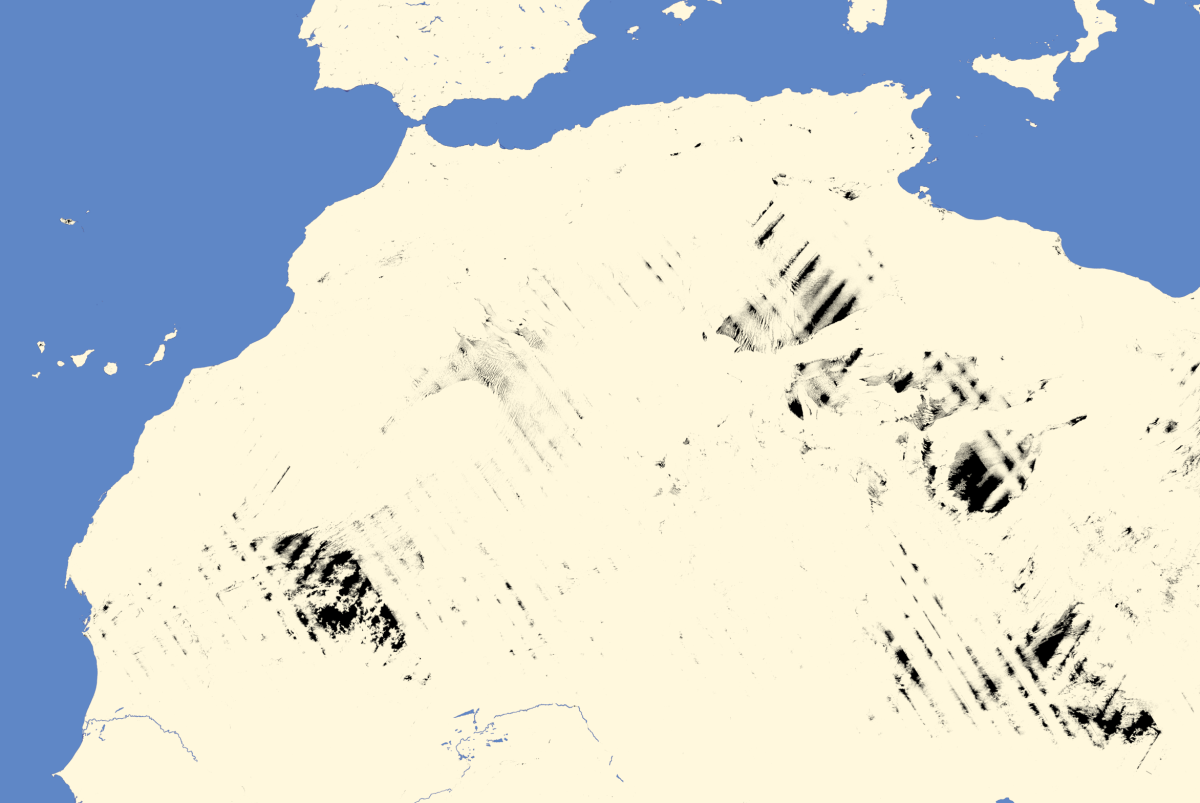
|
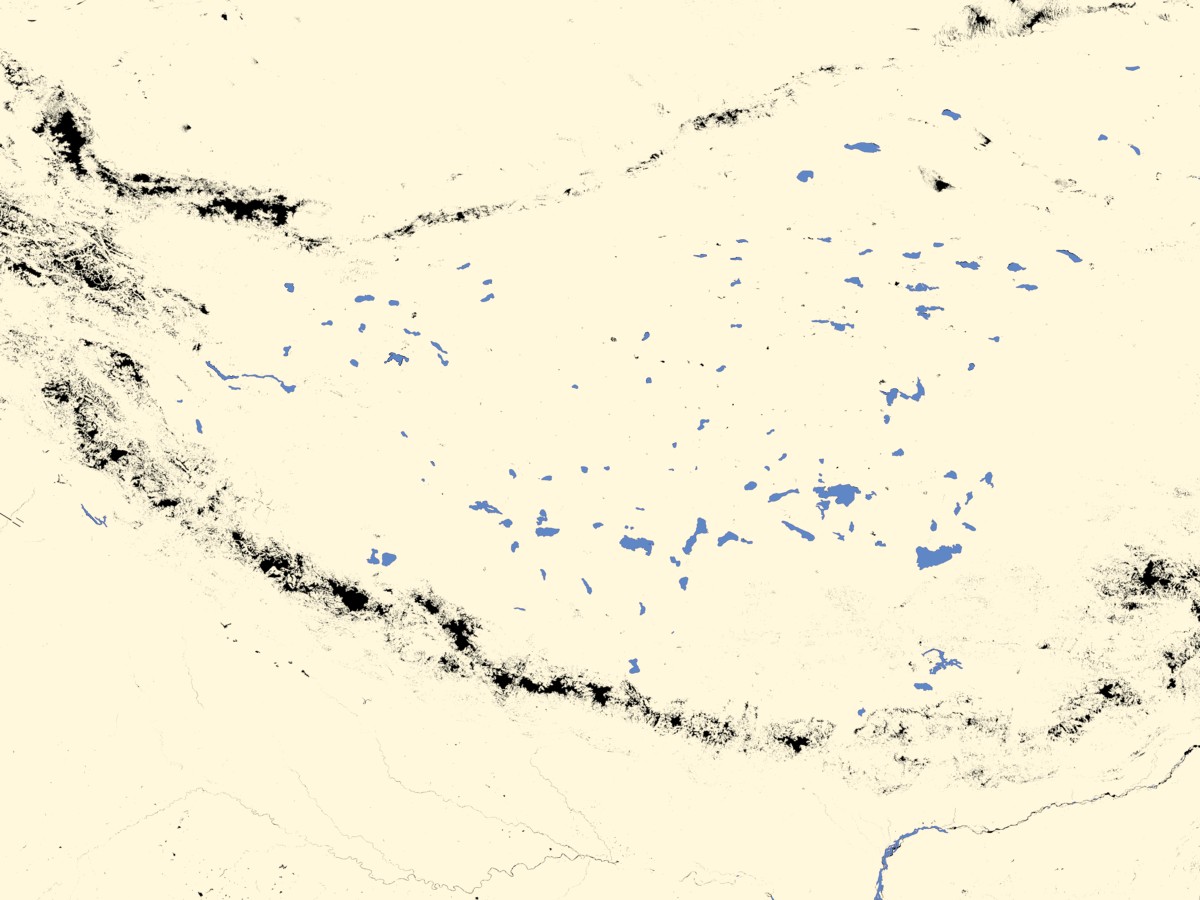
|
| data voids in northern Africa | data voids in the Himalaya mountains |
Especially the last point is a critical one for visualization purposes since the high mountains are well visible and require a more detailed geometry representation than uniformly flat areas.
The most straight away approach to deal with the gaps in the data is to interpolate the missing data points from the existing values. This obviously leads to huge inaccuracies in areas with large height differences in the data voids.
Another possible solution is to fill the gaps with data from other sources. This however only leads to
usable results if the data is of comparable quality. The widely used
![]() GTopo30 hardly leads to better
results than simple interpolation.
GTopo30 hardly leads to better
results than simple interpolation.
Filling the void
On his website ![]() Viewfinder Panoramas
Jonathan de Ferranti makes available data sets that fill some of the most problematic voids in the SRTM data sets
using information from topographic maps. The data sets he offers are in the same format and resolution as the SRTM data
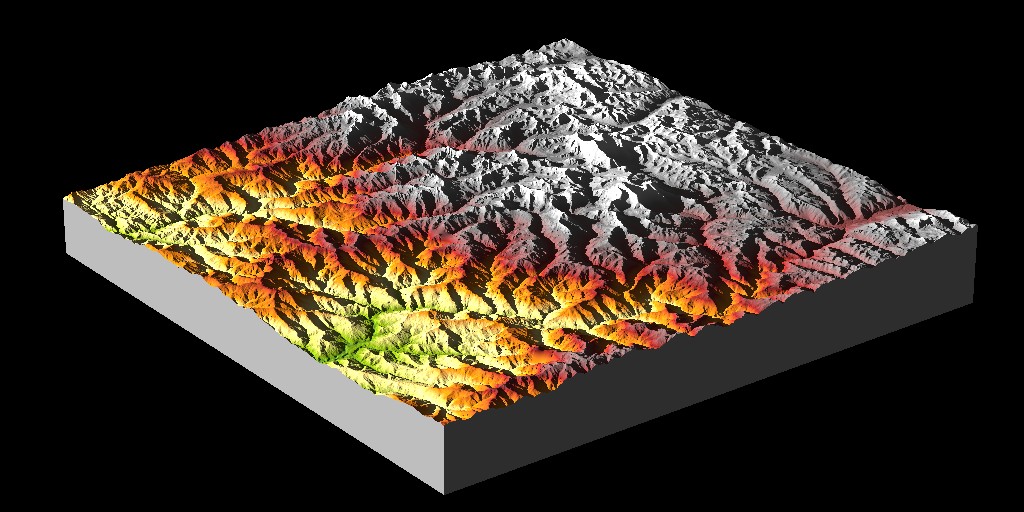
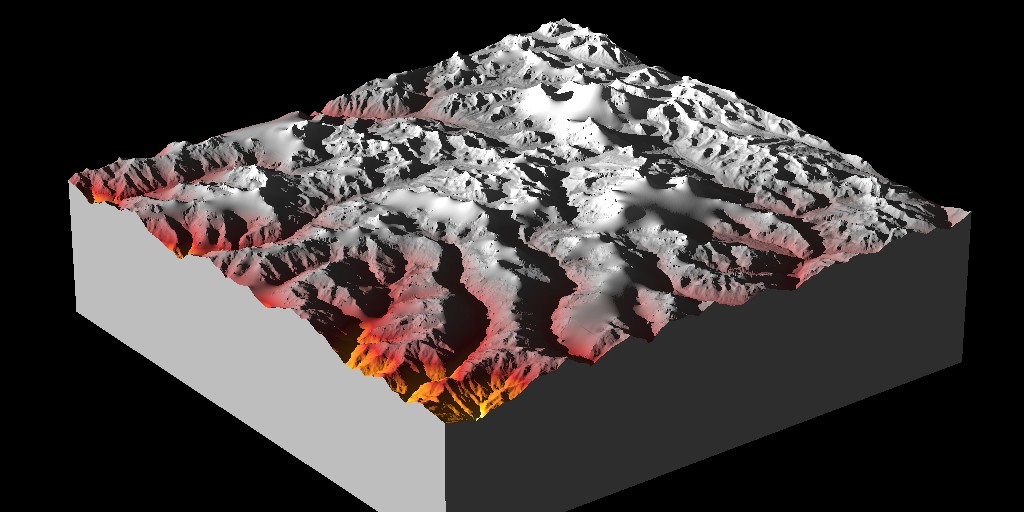
so the same tools can be used for processing them. Below are some test renders using these data sets in comparison
to renders using interpolation as described above.
Viewfinder Panoramas
Jonathan de Ferranti makes available data sets that fill some of the most problematic voids in the SRTM data sets
using information from topographic maps. The data sets he offers are in the same format and resolution as the SRTM data
so the same tools can be used for processing them. Below are some test renders using these data sets in comparison
to renders using interpolation as described above.
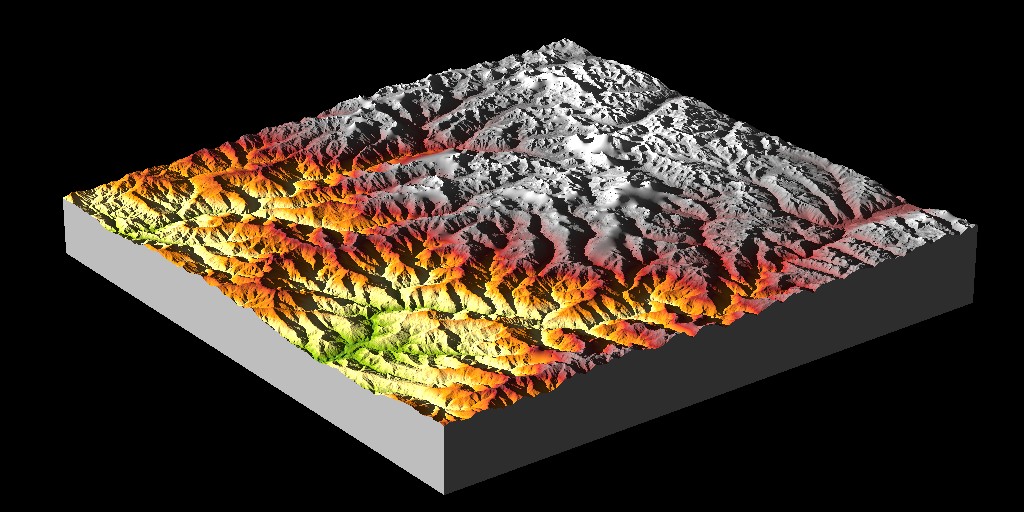
|
|
|
|
| with interpolation | with void fill data |
The results are very good - the elevation data for the voids is well aligned to the SRTM data so there are no visible steps. The void filling is usually not done for the whole tiles however - there are still some (usually smaller) gaps. When you combine Jonathan de Ferranti's data sets with DEMs using a different void filling technique to obtain a completely void-free DEM you will therefore get steps at the edges.
The map below shows the current coverage of Jonathan de Ferranti's DEMs.

As visible he concentrates of the high mountain areas.
And as said (see tile example below) the gaps are often not filled in the whole tiles. In addition to the gap filling he also provides data sources for Norway, Sweden and the Faroe Islands where no SRTM data is available. Despite the large gaps for example in the Grand
Canyon he does not provide files for Northern America since full coverage data sets of good quality are available there from government
institutions (![]() USA,
USA, ![]() Canada).
Canada).

see also another map with coverage in southeast Europe
Conclusion
Obviously digitizing topographic maps to fill the voids in the SRTM data set is a cumbersome process. Therefore it will probably hardly be feasible to fill all gaps in the global SRTM data set using this method. But for the areas covered Jonathan de Ferranti's files provide an elevation model of a quality at least comparable to the surrounding SRTM data.
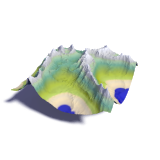
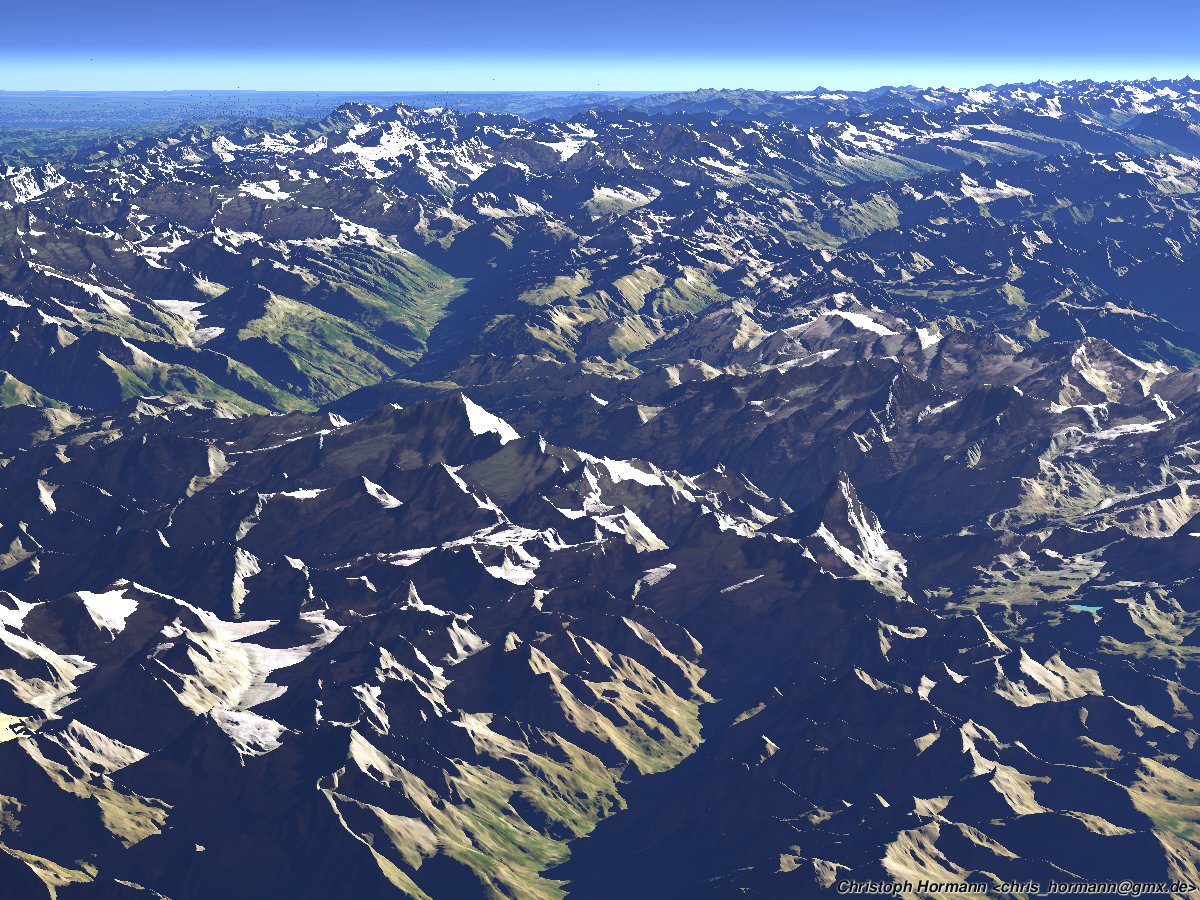
Usage example
Here is one of the first views generated using the void fill data:
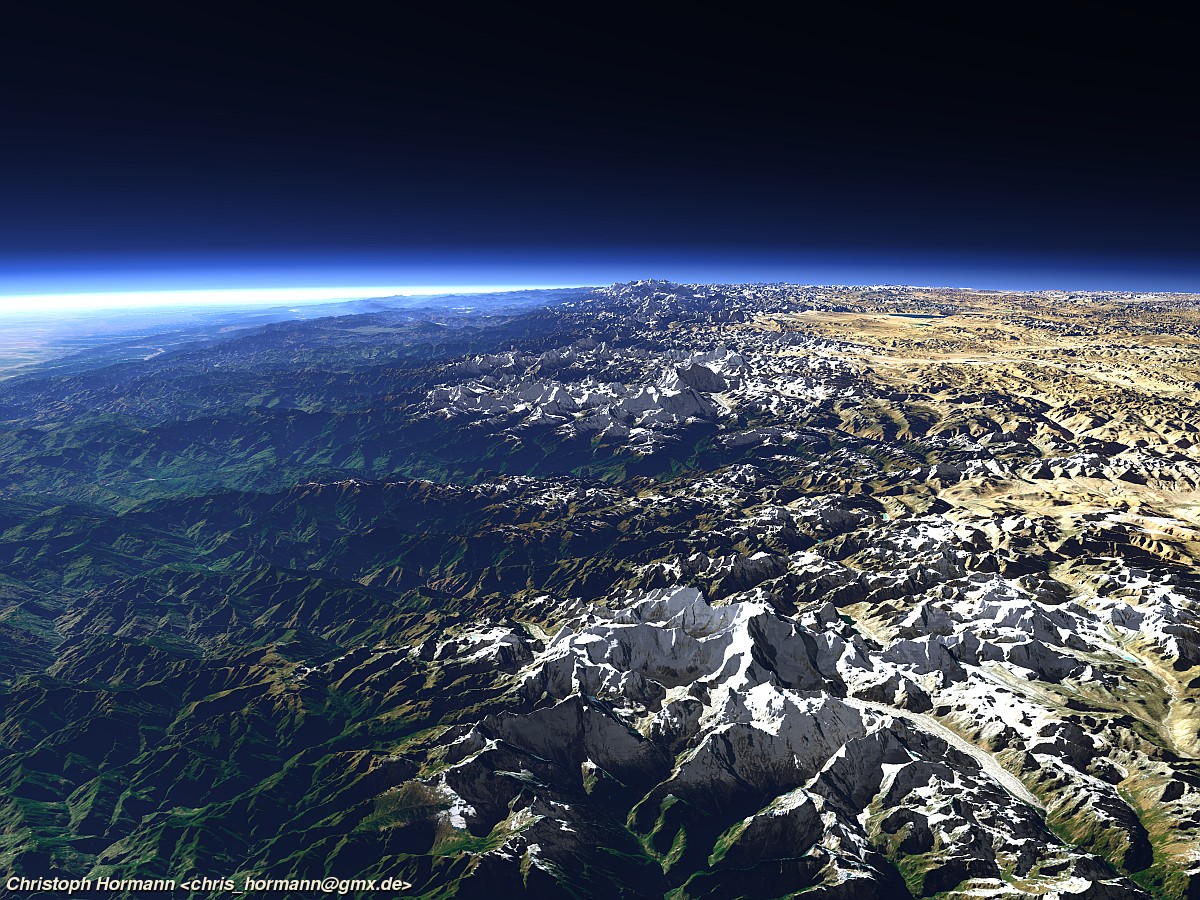
More images can be found on the Views of the Earth site.
Update: 1 arc second data
Jonathan has meanwhile also put up a set of 1 arc second tiles for the alps. A coverage map can be seen below.
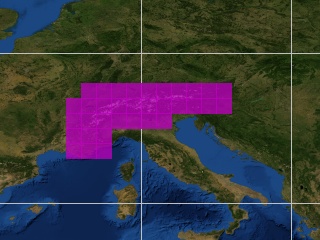
The tiles are completely based on digitized topographic maps. The quality compared to the SRTM data is quite good but a 1 arc second grid is much more prone to typical contour line terracing artefacts and numerical problems due to the 1m vertical resolution than lower resolution 3 arc second files. While the quality of the 3 arc second version is mostly limited by the quality of the maps used the digitization and interpolation algorithms have quite a large influence on the results here. Problems especially turn up in the flatter regions. The high mountain areas are mostly all right.
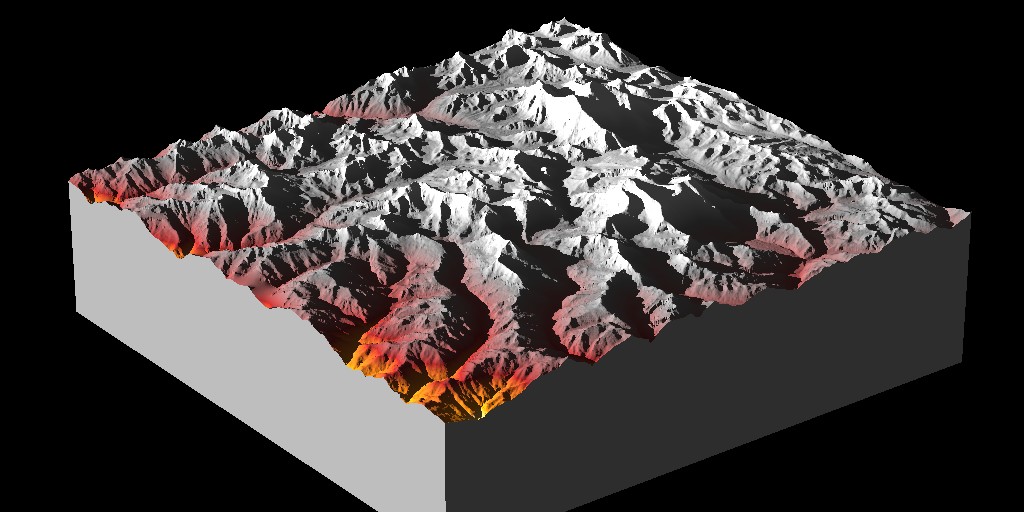
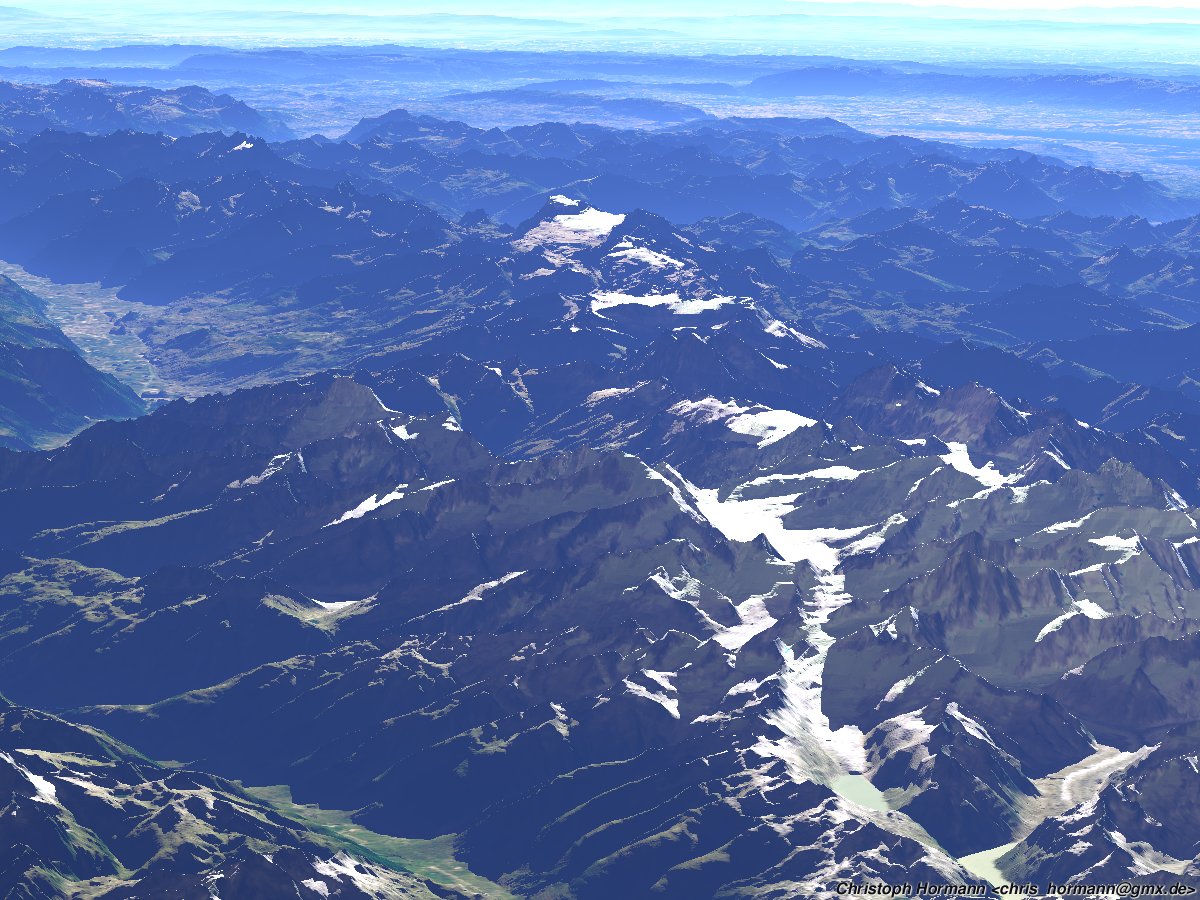
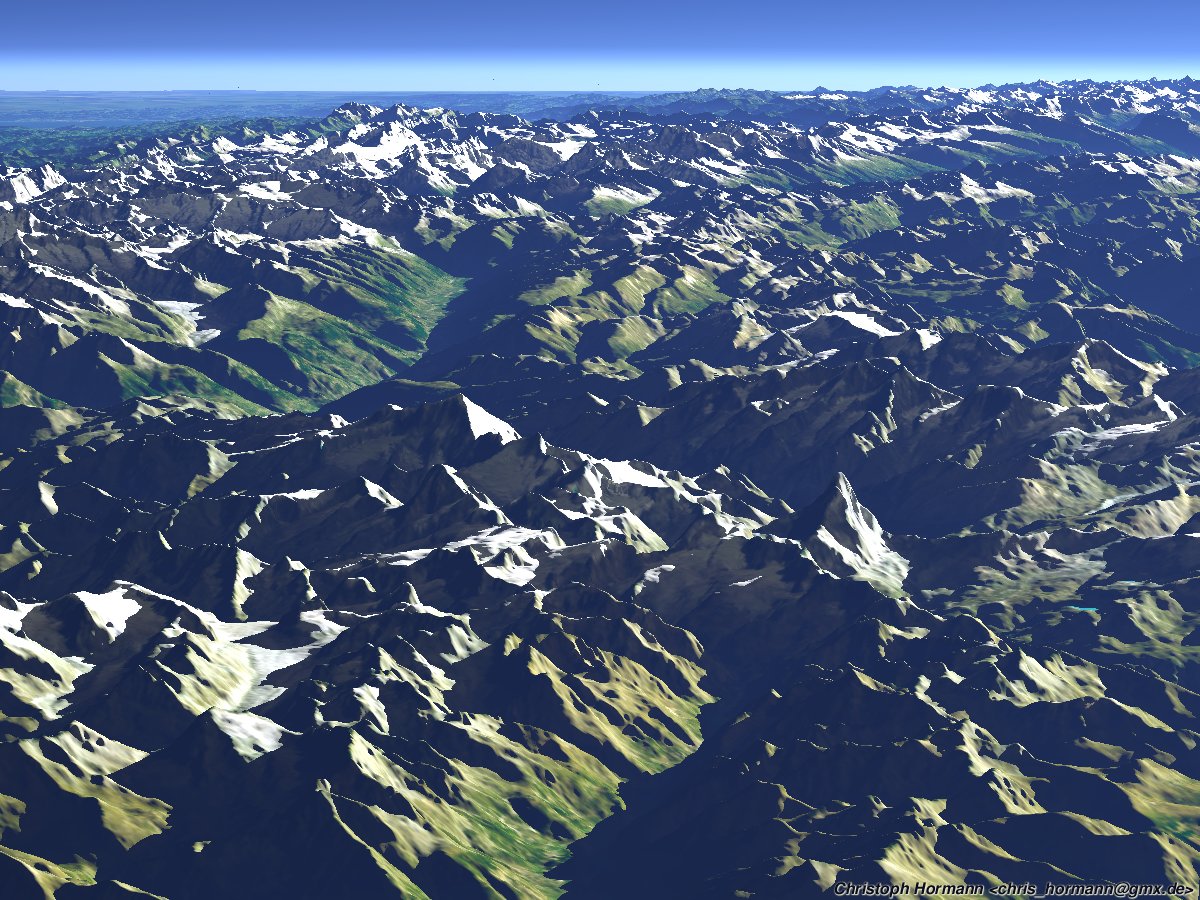
Below are a few examples from renders comparing the 1 arc second version with 3 arc second SRTM data with Jonathan de Ferranti's files only used to fill the voids.

|
|
|
|
| 3 arc second SRTM DEM (+map based void fills) | 1 arc second map-derived DEM |
