About the Eastern Tibet topographic map demo
The Eastern Tibet topographic map demo demonstrates how various freely available data sources can be combined to produce maps and introduces a number of newly developed techniques for map rendering. Here i want to explain a few things on data sources and techniques and also discuss some of the unresolved issues visible in the map.
This map is somewhat different from other topographic map renderings available on the Internet like
![]() Google maps terrain,
Google maps terrain,
![]() Shaded Relief,
Shaded Relief,
![]() OpenCycleMap or
OpenCycleMap or
![]() TopOSM.
All these maps display the topography in addition to economical, political and cultural data. In this demonstration I try to focus on the natural geography with topography, land cover and hydrography as the major components and by doing so i hope to be able to produce a high quality map rendering of those aspects without getting sidetracked and having to compromise due to other aspects of the map. The quality of the map is of course both a matter of the data used and the processing so i will discuss both points a bit in the following.
TopOSM.
All these maps display the topography in addition to economical, political and cultural data. In this demonstration I try to focus on the natural geography with topography, land cover and hydrography as the major components and by doing so i hope to be able to produce a high quality map rendering of those aspects without getting sidetracked and having to compromise due to other aspects of the map. The quality of the map is of course both a matter of the data used and the processing so i will discuss both points a bit in the following.
Data sources


Starting point for creating this map was the river mapping technique i introduced recently and the sample data set available on that page. Accurate and uniform quality river data is an issue for all maps aiming for global coverage. In the area of this map the rivers in Google Maps for example show a major offset to the relief data making the map nearly unusable at higher magnifications in those aspects. The map here uses my satellite data derived river data as the main source for the rivers and lakes displayed (supplemented by ![]() Openstreetmap data). So the map can also be used to inspect my river data without the need to download the full data set. Note that the data has been generalized to some extent for map rendering so appearance might differ slightly from a rendering directly based on the sample data.
Openstreetmap data). So the map can also be used to inspect my river data without the need to download the full data set. Note that the data has been generalized to some extent for map rendering so appearance might differ slightly from a rendering directly based on the sample data.
The labeling of the water bodies is based on Openstreetmap data and therefore only covers the major rivers and lakes. Both Openstreetmap and my own river data are licensed under the
![]() Open Data Commons Open Database License (ODbL).
Open Data Commons Open Database License (ODbL).
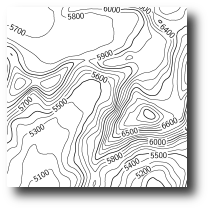
The shaded relief representation as well as the contours at the higher zoom levels are based on
![]() NASA SRTM data supplemented by
NASA SRTM data supplemented by
![]() Jonathan de Ferranti's void fill data.
Jonathan de Ferranti's void fill data.
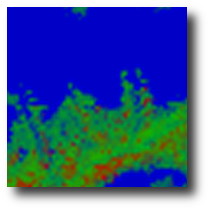
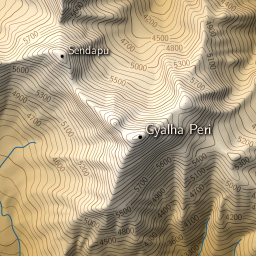
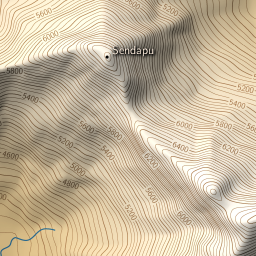
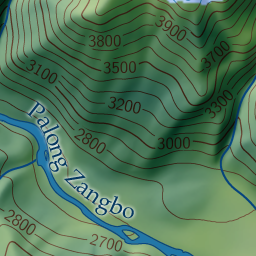
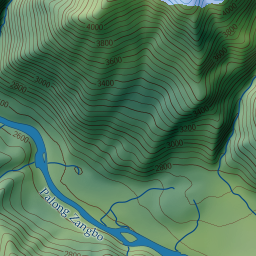
The map is produced and can be viewed in two versions: with hypsometric coloring based on elevation and with land cover coloring. For land cover coloring i used the
![]() MODIS Vegetation Continuous Fields data from the
MODIS Vegetation Continuous Fields data from the ![]() Global Land Cover Facility
combined with the snow and ice mask generated as a byproduct of the river mapping technique. The MODIS data is not particularly high resolution
but it offers a gradual quantification of the land cover. Most maps use classification for land cover display but this is always black and white while in nature land cover can continuously change.
Global Land Cover Facility
combined with the snow and ice mask generated as a byproduct of the river mapping technique. The MODIS data is not particularly high resolution
but it offers a gradual quantification of the land cover. Most maps use classification for land cover display but this is always black and white while in nature land cover can continuously change.
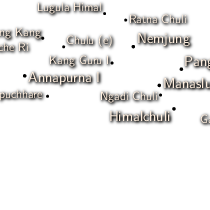
Labeling of the mountains in the map is based on the mountain lists by ![]() Jonathan de Ferranti and
Jonathan de Ferranti and
![]() René M. Derungs.
René M. Derungs.
Processing techniques
Like the other maps linked to above this map can be viewed at different scales (called zoom levels). Now each of these scales is characterized by the level of detail it provides (or in other words: the level of generalization) and by the resolution it is rendered at (the pixel size of the final tiles). I draw all vector data in the map (in this case the contours, water bodies and the labels) to a vector graphics representation first which is then rasterized. This means the map is essentially scale independent at each zoom level. This is particularly important since resolutions of display devices is becoming increasingly variable (up to about 300dpi on some mobile devices). A tile set for such high resolution displays can be generated from the same rendering simply by rasterizing to twice the resolution as shown in the example below.
|

|
|

|
|
|
| small scale rendering | large scale rendering | next zoom level, small scale |
The labels of the mountains are placed using ![]() Dymo, the waterbody labels are placed with a specifically developed program that analyzes the waterbody shape and places the label (in different forms depending on the shape, either single or two lines horizontal or curved) above or next to the water shape. This is still a work in progress and not all label placements are correct yet. All contours, water shapes and labels are rendered into postscript files using
Dymo, the waterbody labels are placed with a specifically developed program that analyzes the waterbody shape and places the label (in different forms depending on the shape, either single or two lines horizontal or curved) above or next to the water shape. This is still a work in progress and not all label placements are correct yet. All contours, water shapes and labels are rendered into postscript files using ![]() Asymptote.
Asymptote.
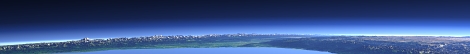
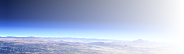
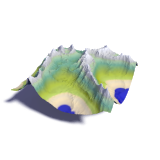
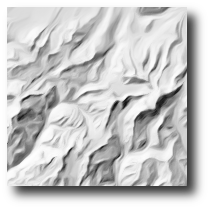
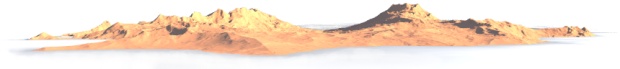
Relief shading is a larger topic i will cover in more detail separately. The shading in this map makes use of adaptive lighting direction similar to what is described on
![]() reliefshading.com but using an automatic technique to perform the adjustment. I also use a new approach to generalize the shaded map producing better results than the commonly used median filter. An outline of the whole process can be seen in the following sample images
reliefshading.com but using an automatic technique to perform the adjustment. I also use a new approach to generalize the shaded map producing better results than the commonly used median filter. An outline of the whole process can be seen in the following sample images


Unsolved problems
There are various flaws in this demonstration map that should be addressed. Some of these issues are due to the data used, others are related to the data processing and map rendering techniques.
The most obvious are the errors in the river data. Since the data has not been manually verified and corrected it contains various more or less obvious errors. It would have been possible to fix the most visible ones without too much work but i decided to use the data as is for the moment. Note the Openstreetmap data used is also far from error free despite being manually generated. Apart from the flaws in the data generalization of the rivers at the lower zoom levels is also not working very well yet.
Labeling in the map comes with several problems. First there is the well known issue of generating well readable text on a high contrast background. This is addressed by adding outlining and shadowing to the text in contrasting colors. For readability alone this could be much improved by using stronger contrasts, i however also wanted the labels to blend in and not too much distract from the rest of the map. With the waterbody labeling i try to align the labels to rivers and lakes but the algorithm used does not always result in the best possible placement. Some of the inconsistencies in labeling are also due to the varying ways features are labeled in Openstreetmap. The mountain label placement currently does not fully take into account the other map features when placing the labels. It mostly avoids placing the labels over lakes though. Similarly the contour labels are sometimes placed too close to rivers and lakes.
Similar to the river data the snow and ice mask is subject to errors. In some areas snow and ice is indicated in areas where it is not permanent. In addition glaciers are frequently not indicated as ice in the lower parts where they are covered by gravel – it is very difficult to distinguish a gravel covered glacier from normal gravel covered ground by automatic processing.
Finally elevation contours are always difficult to use at these relatively low magnifications since the horizontal spacing of the contours varies so much between steep mountain areas and flat parts. The placement of supplemental dashed contours in the flat areas is also something that still needs to be improved.
Christoph Hormann, November 2012
Visitor comments:
no comments yet.
By submitting your comment you agree to the privacy policy and agree to the information you provide (except for the email address) to be published on this website.