ArcticDEM elevation data review
Here i am reviewing the ![]() ArcticDEM elevation data set that is currently being produced by the University of Minnesota and the US National Geospatial-Intelligence Agency in its status as of relese 5 (from June 2017).
ArcticDEM elevation data set that is currently being produced by the University of Minnesota and the US National Geospatial-Intelligence Agency in its status as of relese 5 (from June 2017).
Context for this data set
This review is part of a series of reviews i have made of open data elevation data sets that have been published for for larger coverage areas above the regional level. In the past i have reviewed:
- SRTM (my review of the latest version here) - this is the pioneer of all modern global or near global elevation data sets that have been remotely acquired to a relatively uniform standard of quality. On the positive side it offers a relatively high level of completeness in its coverage area and a very low frequency of data errors other than data gaps. On the negative side it does not cover areas beyond 60.66 degrees latitude, the data is relatively old meanwhile (nearing 15 years) and is noised and resolution limited on a level that is restrictive for many applications.
 Jonathan's viewfinderpanoramas.org elevation data - supplementing the SRTM data for truly global coverage. This is still the global data set that offers highest quality level, in particular with respect to the lack of any larger errors, on a truly global coverage although large parts of the Antarctic and parts of the Arctic are quite inaccurate by the standards we are used to elsewhere.
- The ASTER GDEM data set (my review here) - the first near global data set produced by means of stereo-photogrammetry. On the positive side it offers coverage beyond the latitude limit of SRTM and including most of the polar regions. On the negative side it shows highly variable quality with lots of data gaps, significant numbers of severe non-gap errors and a relatively high noise level limiting practically usable resolution. Average age of the data basis is around 10-12 years.
- The ALOS AW3D30 data set (my review here) - like ASTER GDEM generated through stereo-photogrammetry but based on much higher resolution source data and resampled to a lower resolution grid for the open data release. On the positive side it offers the highest spatial resolution of all near global open data sources and is also the newest with an average age of the source data of about 8 years. On the negative side quality varies a lot since the source imagery is not recorded with uniform global coverage and data gaps as well as non-gap errors have a high frequency making the notion of a global data set quite a stretch here.
As you can see there are quite a lot of options but none of them being really easy to use. Because of the limitations of the other sources SRTM (and the viewfinderpanoramas.org data which is largely based on it) still form the basis of the vast majority of applications using global elevation data. If we forget the Antarctic (which most people simply ignore) the higher northern latitudes are the areas with the most severe quality limitations, especially since ASTER GDEM and ALOS AW3D30 are also generally fairly bad in these areas.
This is a problem many routine users of elevation data sets are aware of and this need has lead to people looking to produce data from alternative sources. One of these attempts is ArcticDEM and i want to discuss this here.
About the data set
ArcticDEM is financed by the US NGA (i.e. intelligence) and NSF (i.e. science). The idea is to use stereo image pairs from commercial satellite imagery to produce high resolution elevation data for areas north of 60 degrees latitude. Imagery comes from DigitalGlobe satellites and has probably also in large parts already been recorded through government contracts.
The data is based on imagery with sub meter resolution and is originally processed into a 2 meter elevation grid (which is available for download). The elevation data strips from the different stereo pairs are then merged into a common 5m grid. This grid is in a Greenland centered polar stereographic projection and is split into several thousand 10k×10k tiles covering the whole area. My review here is primarily focusing on the 5m grid - which is probably also what most data users will use.

|
| ArcticDEM strip file example |

|
| ArcticDEM tile example |
The data in distributed in tar archives (some of them gzipped, some not - apparently someone could not decide here if double compression makes sense or not) containing the elevation data as GeoTIFF files (compressed) with 32 bit float values, pixels with no data have a value of -9999. A separate nodata mask and two metadata text files are also included as is a shapefile with the tile footprint. There is no gridded QA data available to allow any kind of quality assessment for the data itself.
The terms of use/license conditions are a bit obscure. The UMN which provides the download infrastructure points to its ![]() acknowledgement policy which describes how they want to be cited for scientific uses of the data but which does not really clarify if and how you may use the data for other purposes. Elsewhere
acknowledgement policy which describes how they want to be cited for scientific uses of the data but which does not really clarify if and how you may use the data for other purposes. Elsewhere ![]() they write: ArcticDEM data is an unlicensed product and may be used, distributed, and modified without permission. The NGA
they write: ArcticDEM data is an unlicensed product and may be used, distributed, and modified without permission. The NGA ![]() uses the same formulation. This probably means the data is legally in the public domain but the UMN would like to be credited and is probably legally required to ask for credit for the NSF.
uses the same formulation. This probably means the data is legally in the public domain but the UMN would like to be credited and is probably legally required to ask for credit for the NSF.
The source data is relatively new but it varies quite a bit depending on where you look. Here the overall statistics:
| year | strip count |
|---|---|
| 2008 | 14 |
| 2009 | 16 |
| 2010 | 126 |
| 2011 | 725 |
| 2012 | 7701 |
| 2013 | 14552 |
| 2014 | 11550 |
| 2015 | 15320 |
| 2016 | 8600 |
And here the spatial distribution of the median year:

|
| ArcticDEM source data age - the median year of the source imagery within each data tile |
Coverage
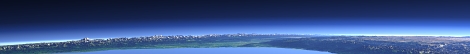
The first look goes to the coverage of the data set. Currently this is still incomplete, it lacks the southmost parts in Eurasia, but it is complete around the pole at the higher latitudes in terms of nominal coverage. Distribution of gaps is however fairly non-uniform. Here an illustration with the data gaps over land in red and the data gaps over water (which are not an issue) in dark gray-blue:

|
| ArcticDEM coverage - shaded relief with the data gaps over land in red |
As you can see in some areas the gaps are quite significant, in particular in Alaska, Yukon and large parts of Russia. Very high latitudes on the other hand are relatively well covered. I did not do further statistics on the gaps because as i will explain they only tell part of the story. Gaps are usually either due to clouds in images (and therefore often concentrate in mountain areas) and due to gaps in source image coverage. Relief self shadowing due to low sun position can also lead to artefacts but sometimes valid data points also exist in shadow areas, usually with a much higher noise level though.
Completely missing in the data are currently Kvitøya, Kong Karls Land, Hopen, Victoria Island, Peschany Island, Henrietta Island, Jeannette Island, Herald Island and the Komandorskie Islands - the last being south of 60 degrees latitude but you would normally expect them to be included since both Kamchatka and the Aleutian Islands are.
Data quality
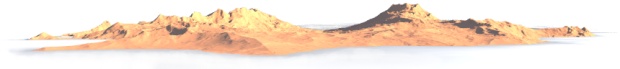
Spatial resolution is pretty good. Here a comparison of the 5m grid with ALOS AW3D30 and the viewfinderpanoramas.org data.

|

|

|
| ArcticDEM | ALOS AW3D30 | viewfinderpanoramas.org |
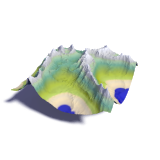
So with the high spatial resolution and fairly recent source images you would, despite the data gaps, expect the data to be quite useful. But here comes the tricky part. The data gaps are by far not the only type of error in the data. Artefacts in the data outside of the gaps are quite abundant and since there is no QA data provided that could be used to distinguish more reliable from less reliable data points these artefacts are pretty hard to deal with which severely limits usability of the data. Here an example.

|
| Typical ArcticDEM artefacts |
Very small artefacts could be eliminated at the cost of resolution with a median filter but artefact size distribution is fairly broad. Here another example.

|
| Typical ArcticDEM artefacts |
In this second example you can also well observe the differences in noise levels between different quality images and between sunlit and shadowed areas as well as step artefacts due vertical calibration differences. Here these are largely on glaciers so they can be explained by the thickness of the glacier changing but you also have such steps in flat areas with no plausible natural causes. There is also sometimes a bit of banding visible in the noise levels but this is usually not significant.
In light of the abundance of artefacts not providing any QA data is a peculiar decision. It is usually not difficult to generate some kind of match quality assessment from stereo-photogrammetry algorithms.
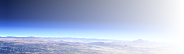
Another problem of the data is the elevation calibration. To improve the absolute accuracy of the elevation data the elevation values are corrected with high accuracy low resolution satellite altimeter data. But this is apparently done rather poorly leading to significant differences between the individual image strips. This can be best seen at the coast. Here an example from Franz Josef Land.

|
| ArcticDEM elevation calibration problems |
You can see that the sea level elevation varies quite a bit from east to west and also between the different source images. This variance is too large to be dealt with by simple waterbody flattening. You need to properly compensate the data for this dynamic offset to accurately model the coastal areas and not get artificial cliffs at the coastline.
Positional accuracy is hard to judge in absolute terms due to lack of accurate reference data but it is most likely better than any of the lower resolution data sets.
Summary
The ArcticDEM elevation data set provides a lot of data on relief in areas that are poorly covered by other sources. Practical use of the data is severely hampered by the presence of artefacts in the data which are often not easy to detect and masked by automatic methods. The lack of quality metadata further complicates this. Significant processing and often also additional data sources will be required to generate consistent high quality relief data from this data source, even if a significantly lower resolution is acceptable.
Christoph Hormann, September 2017
Visitor comments:
no comments yet.
By submitting your comment you agree to the privacy policy and agree to the information you provide (except for the email address) to be published on this website.