About a year ago i wrote my report on the first year acquisitions of Sentinel-2 as well as for Landsat on a matching time frame. This was – and still is to my knowledge – the most detailed and accurate analysis of image data available from these satellites. Here is an update of this for a time frame from October 2016 to October 2017.
The October division is meant to include exactly one summer season of both the northern and the southern hemisphere. A calender year based division would always split the southern hemisphere summer season.
Here is the plot for the overall recording volume of all satellites:

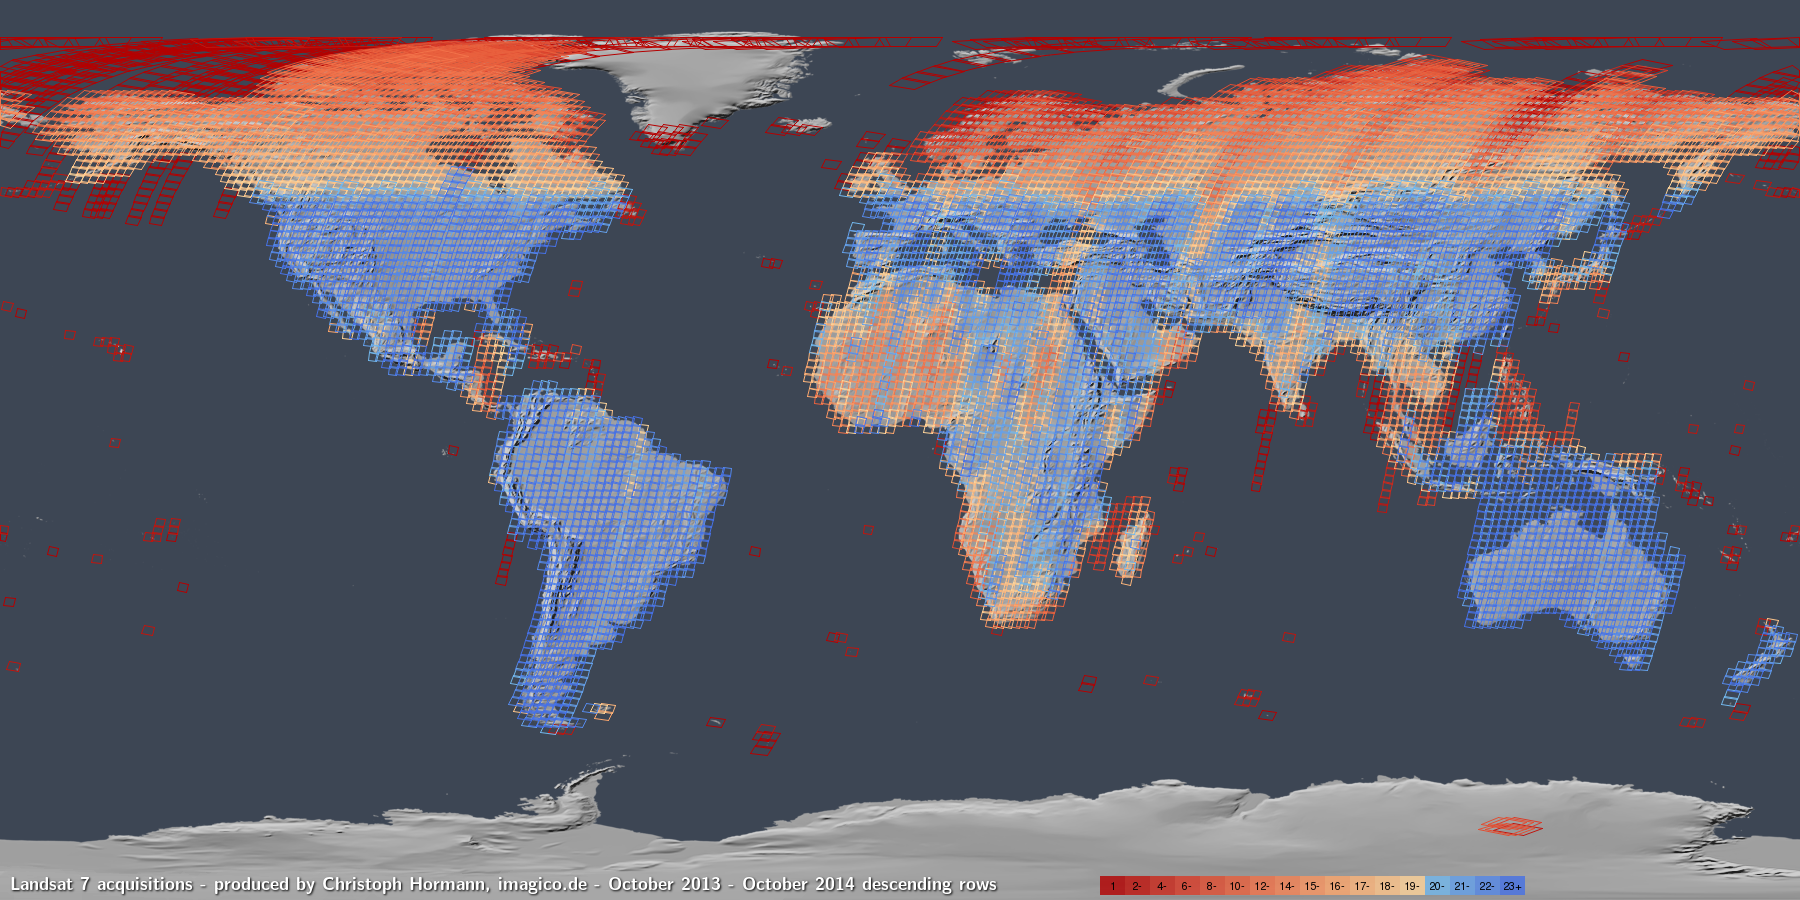
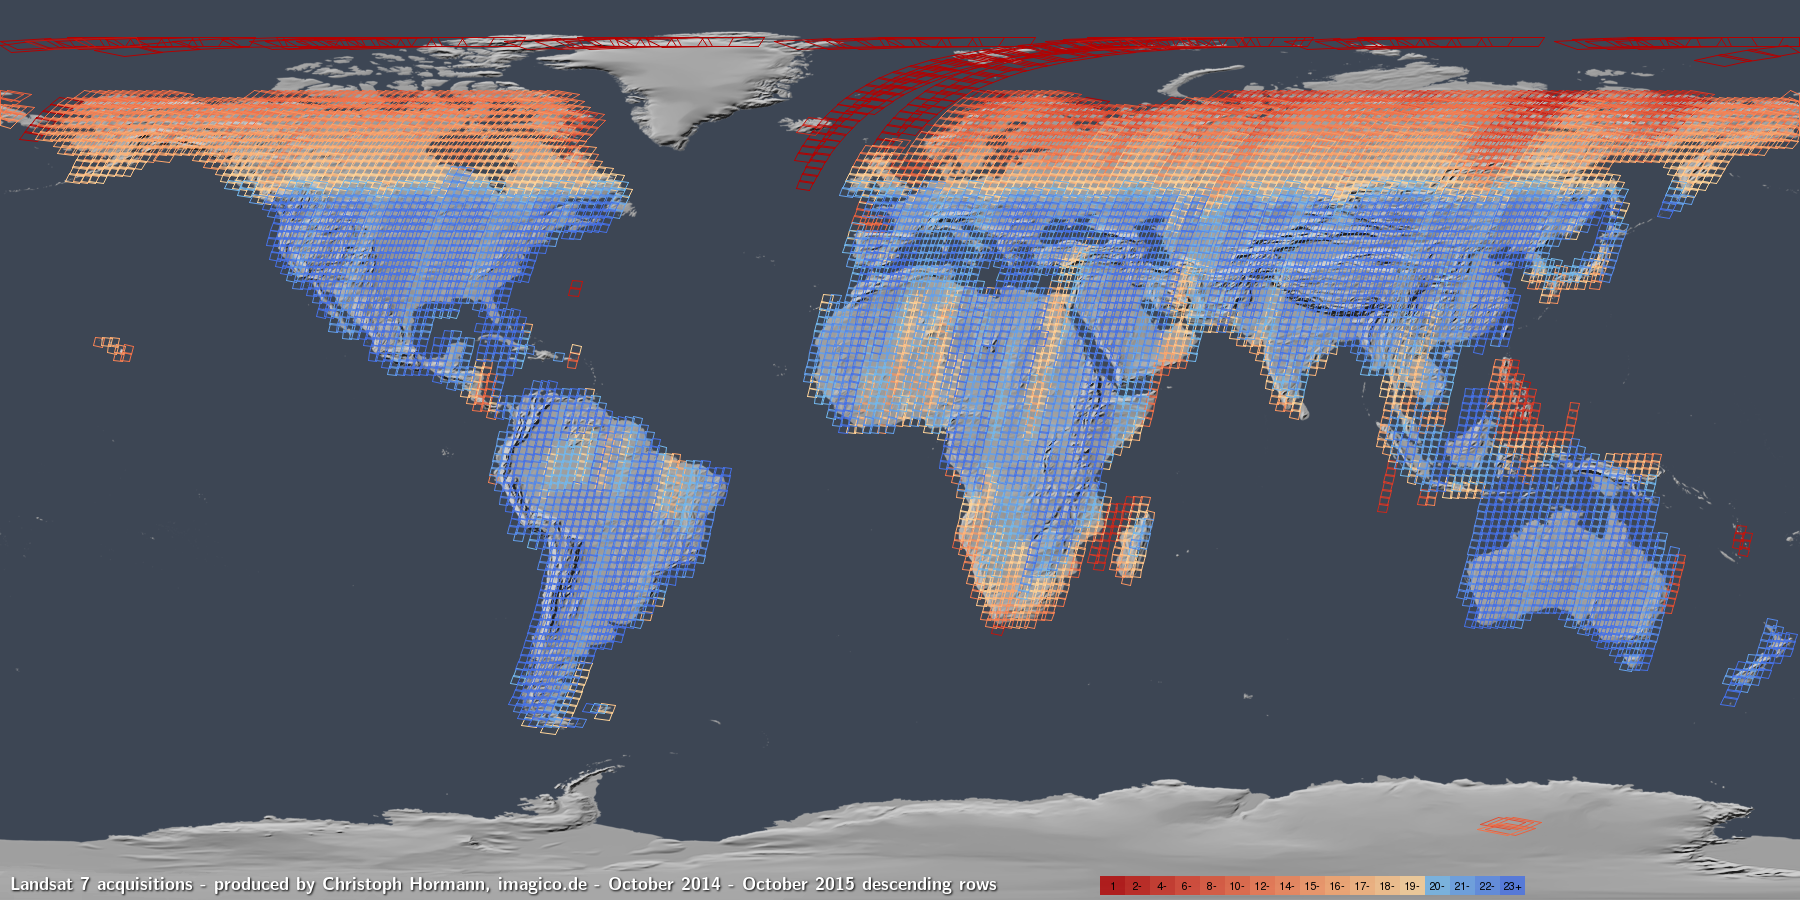
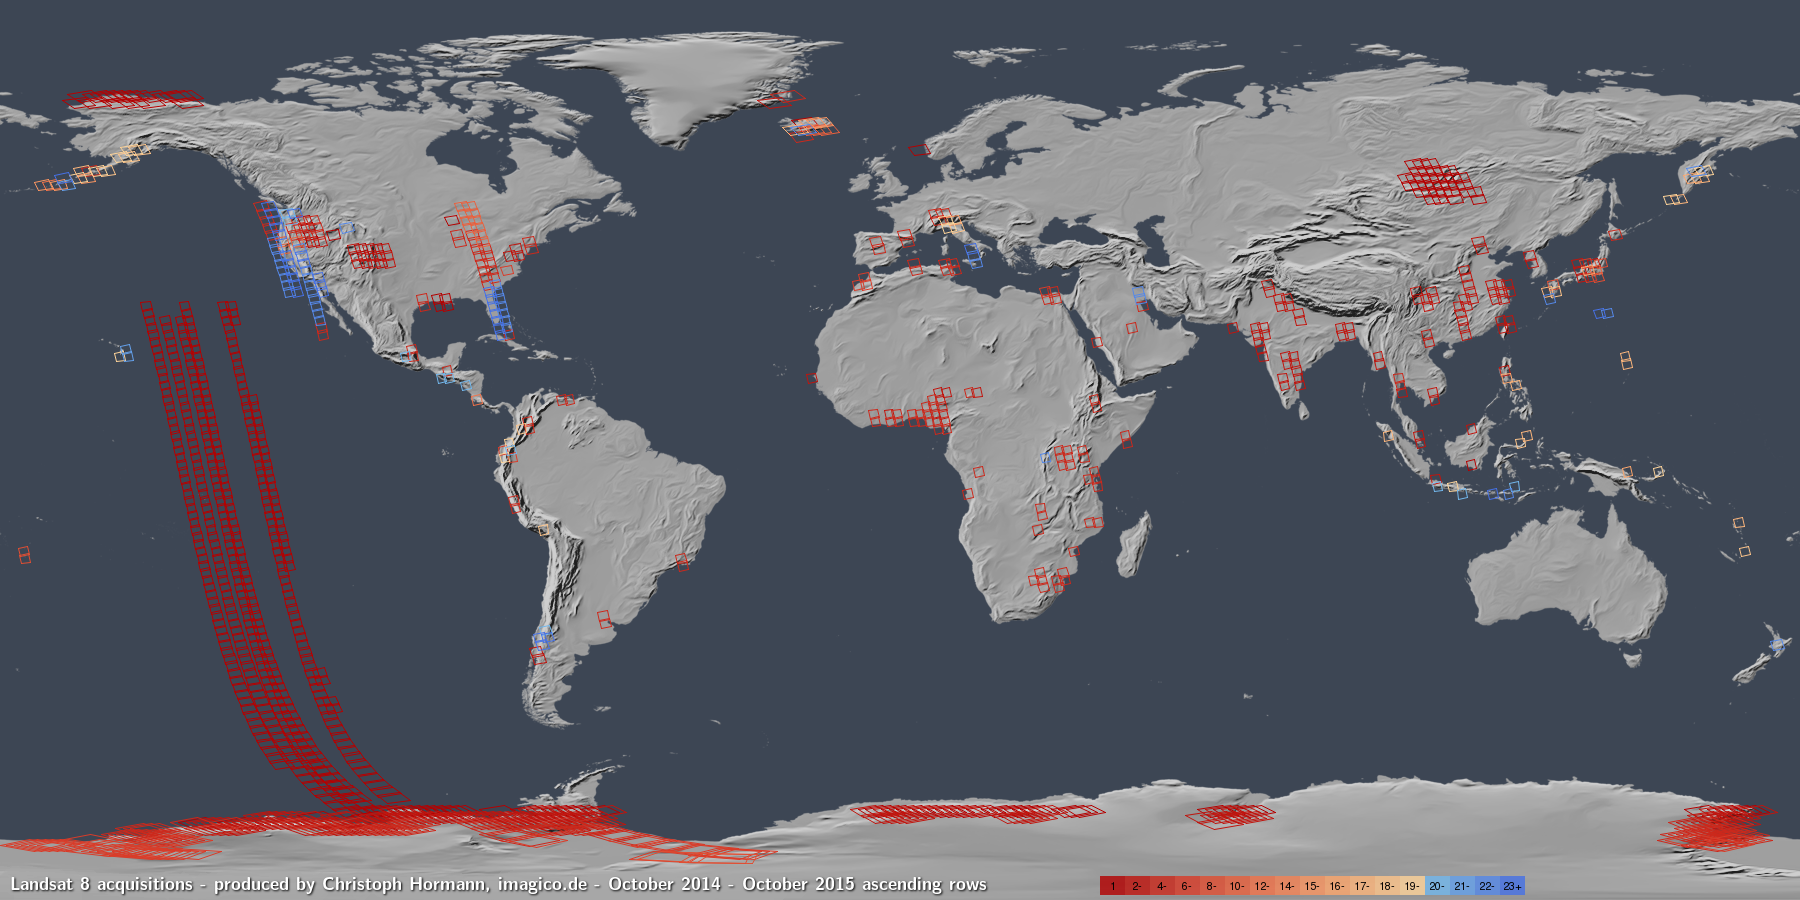
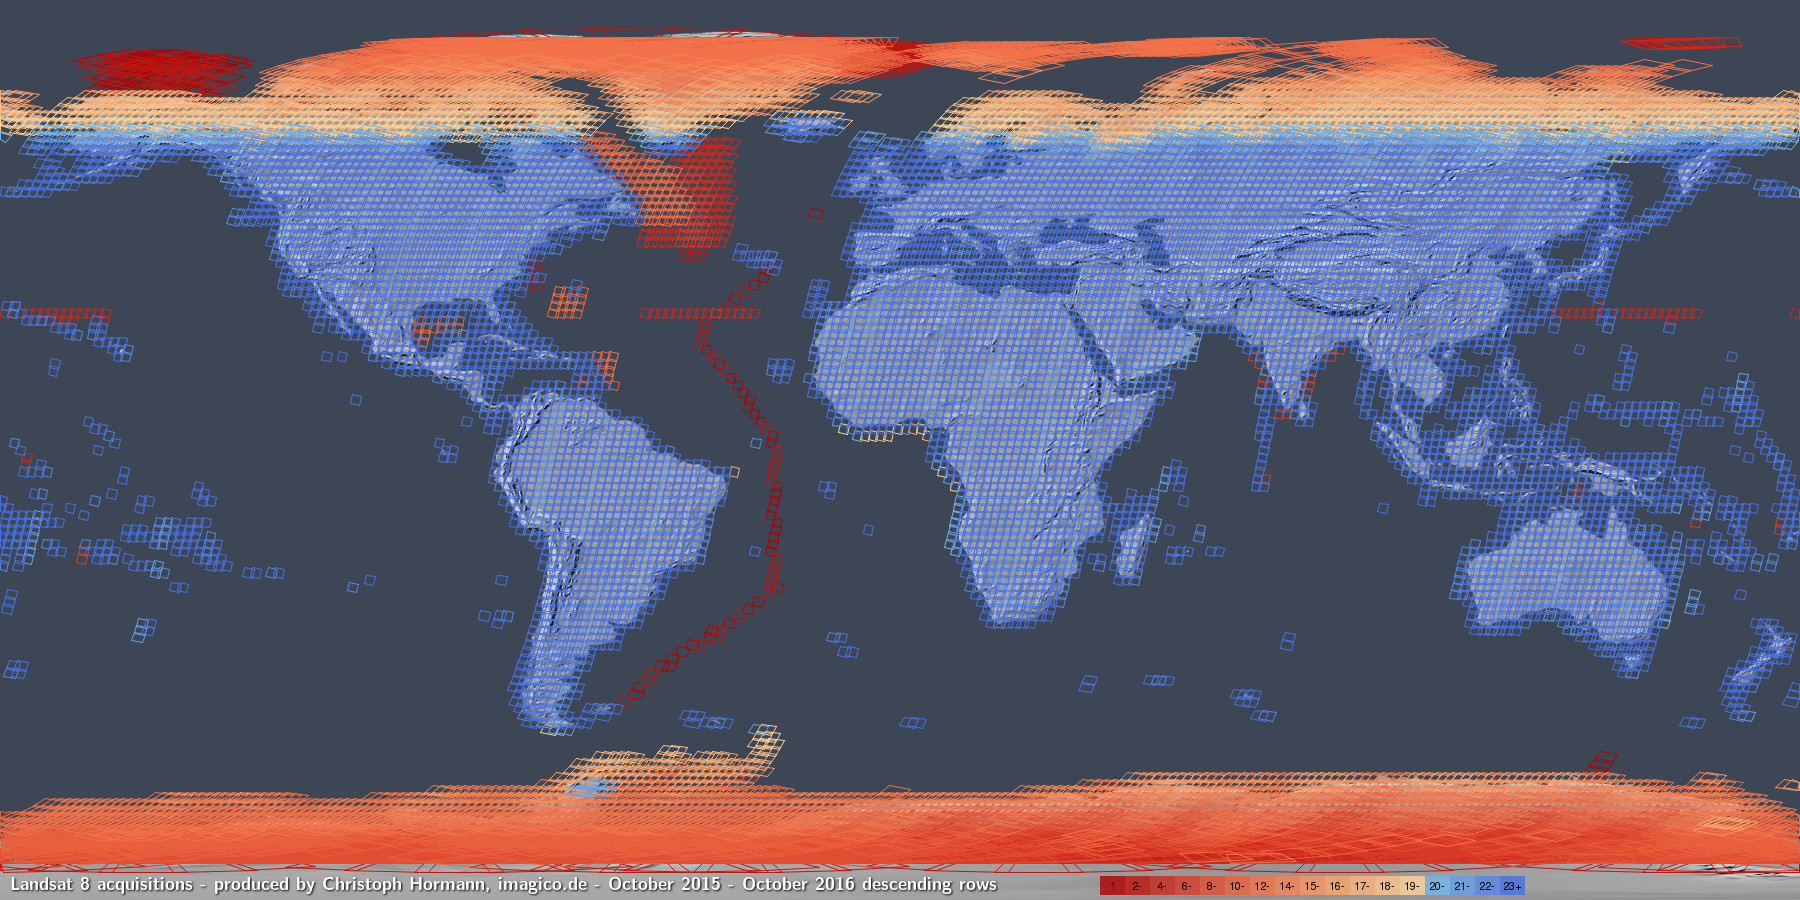
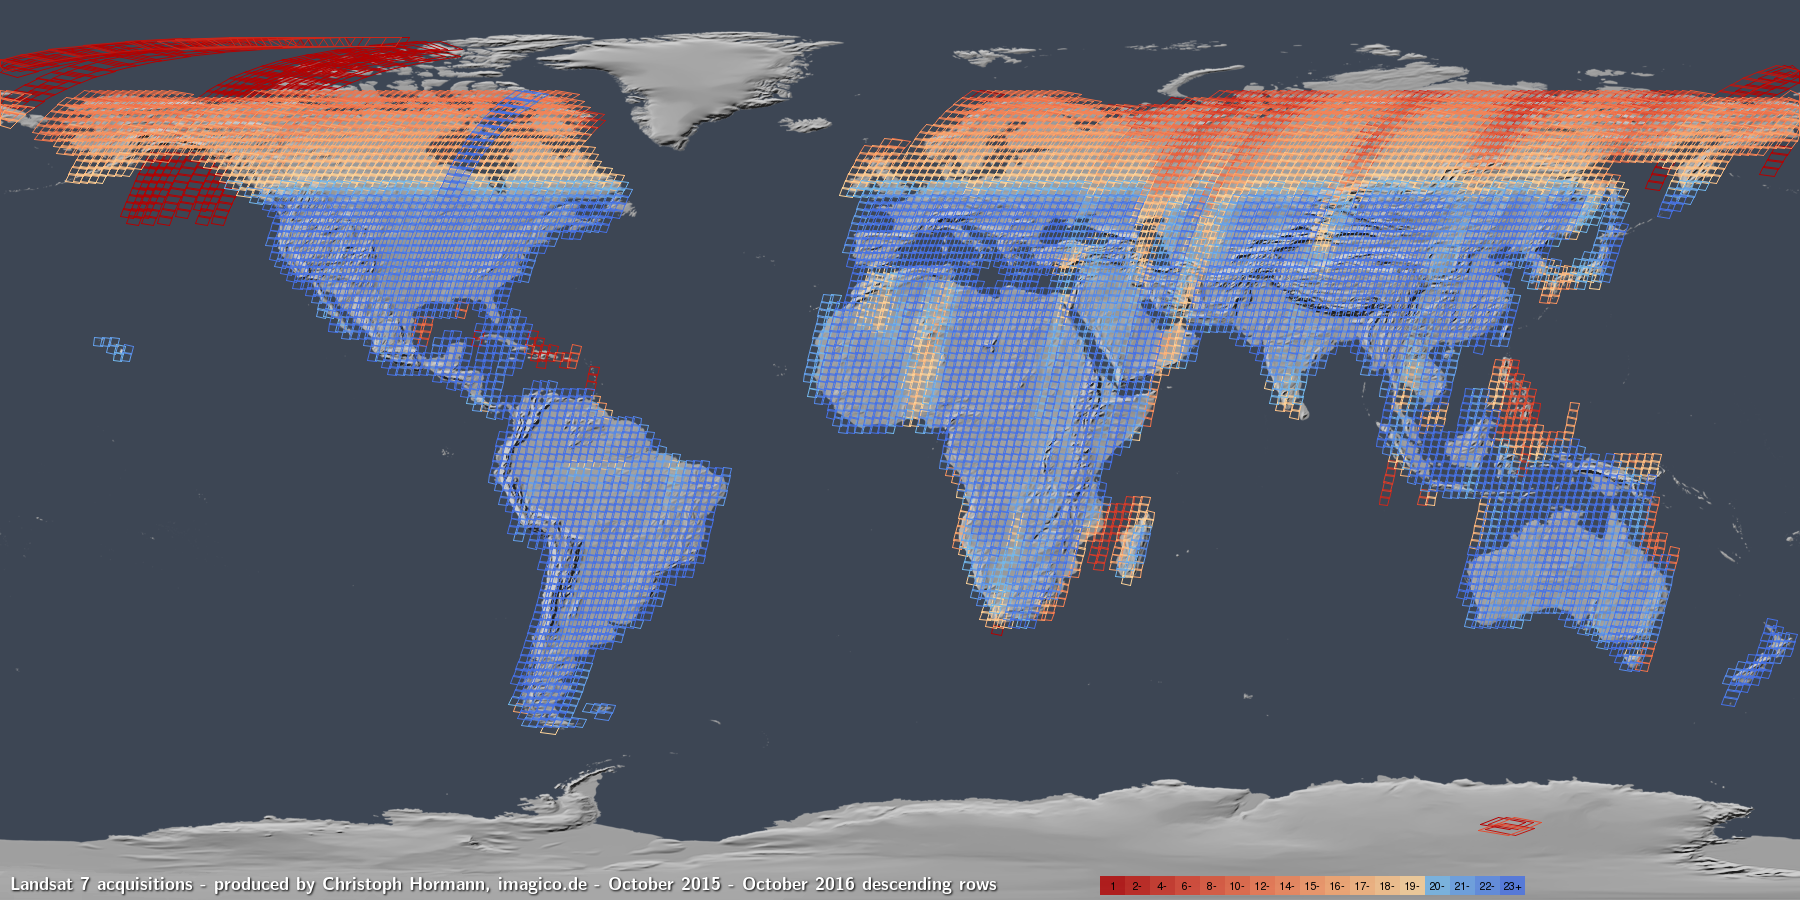
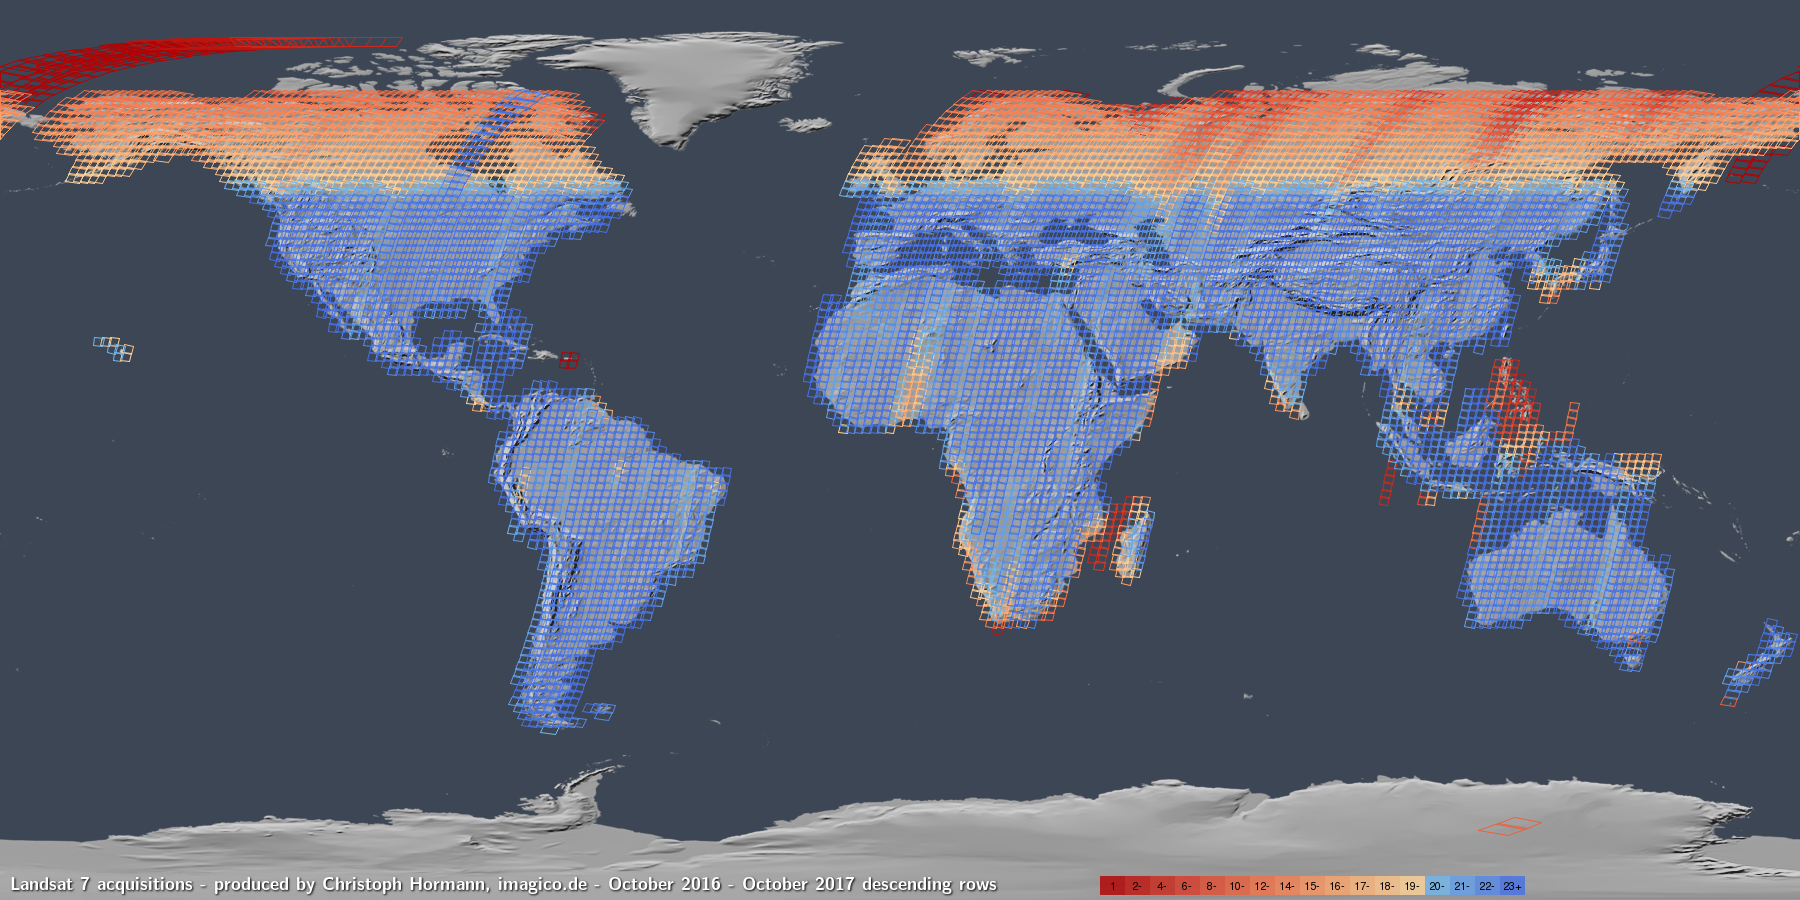
Landsat
Both Landsat satellites have operated during the last year without any notable incidents or interruptions of recordings. Landsat 7 had its last orbit maintainance maneuver in early 2017 and is now in a steadily declining orbit which means the recording time frame will move from the current about 10:15 to earlier times as it has happened for EO-1 previously.
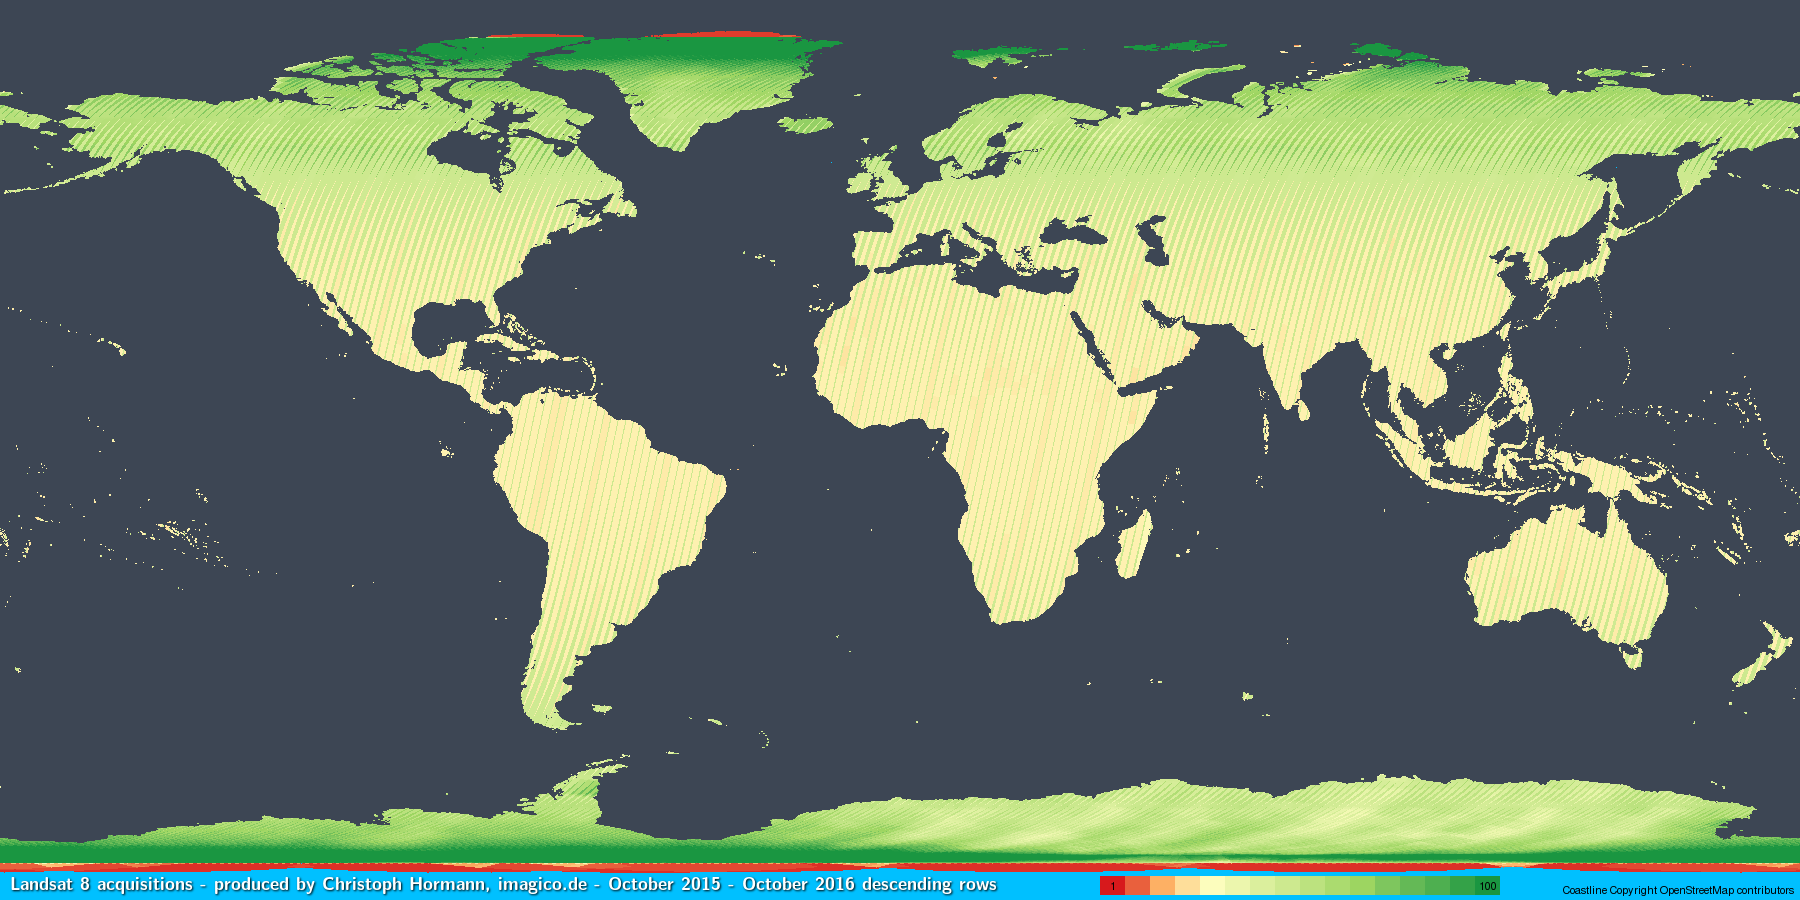
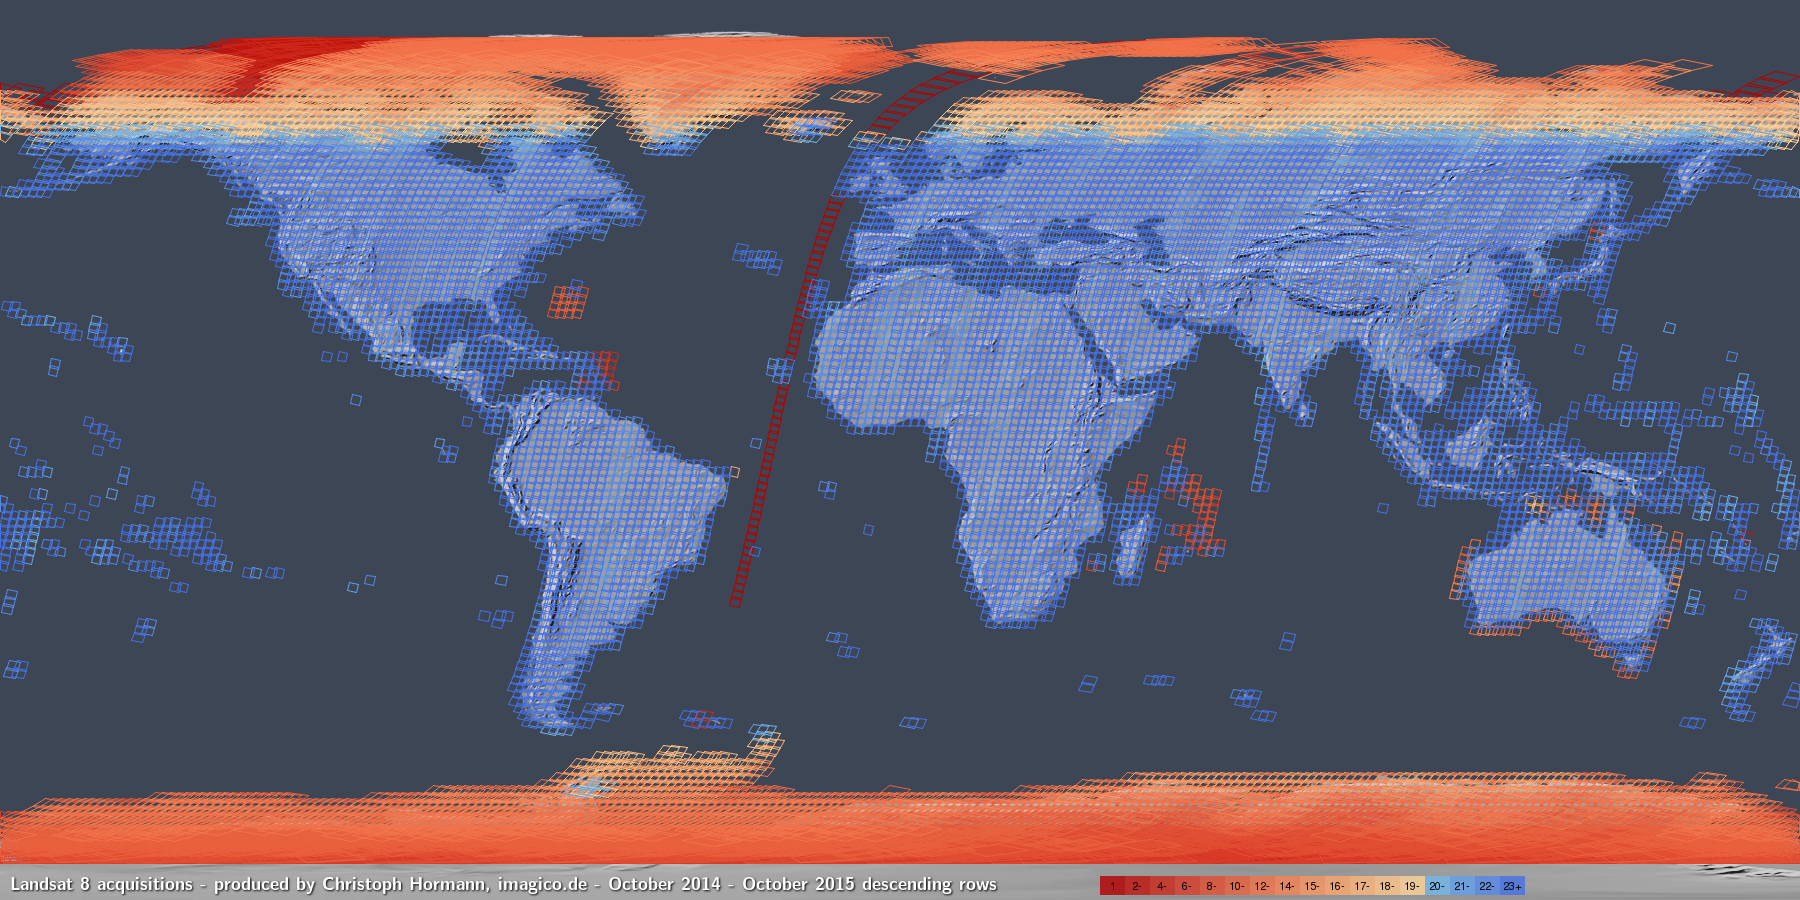
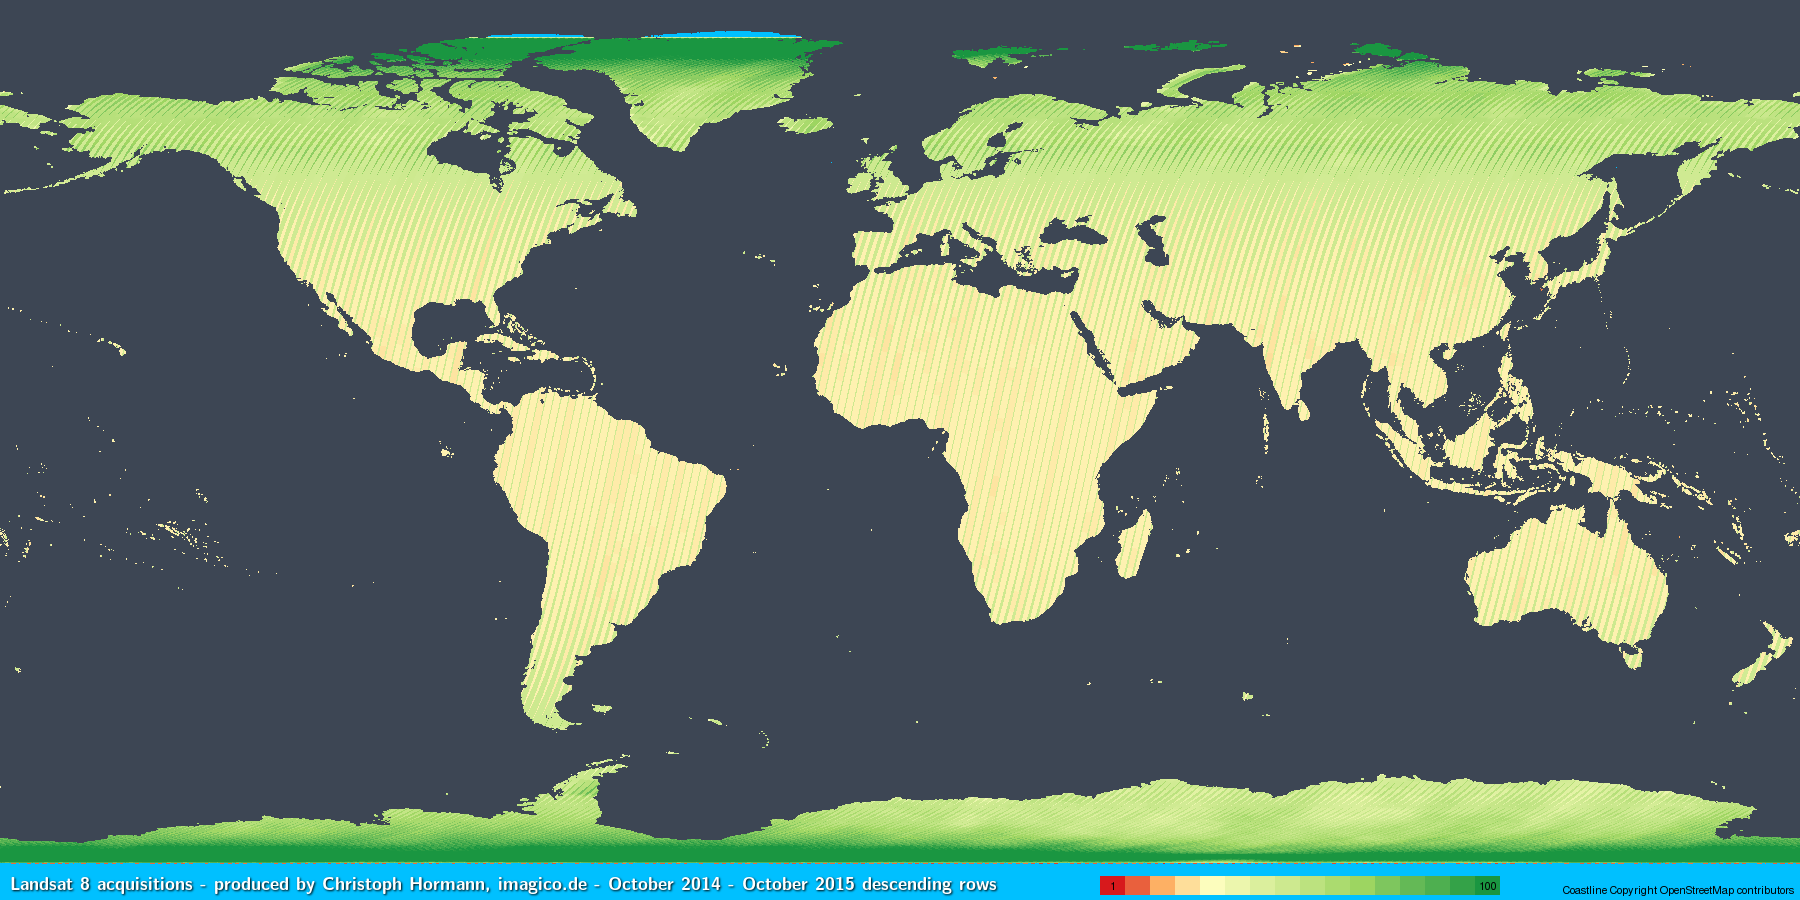
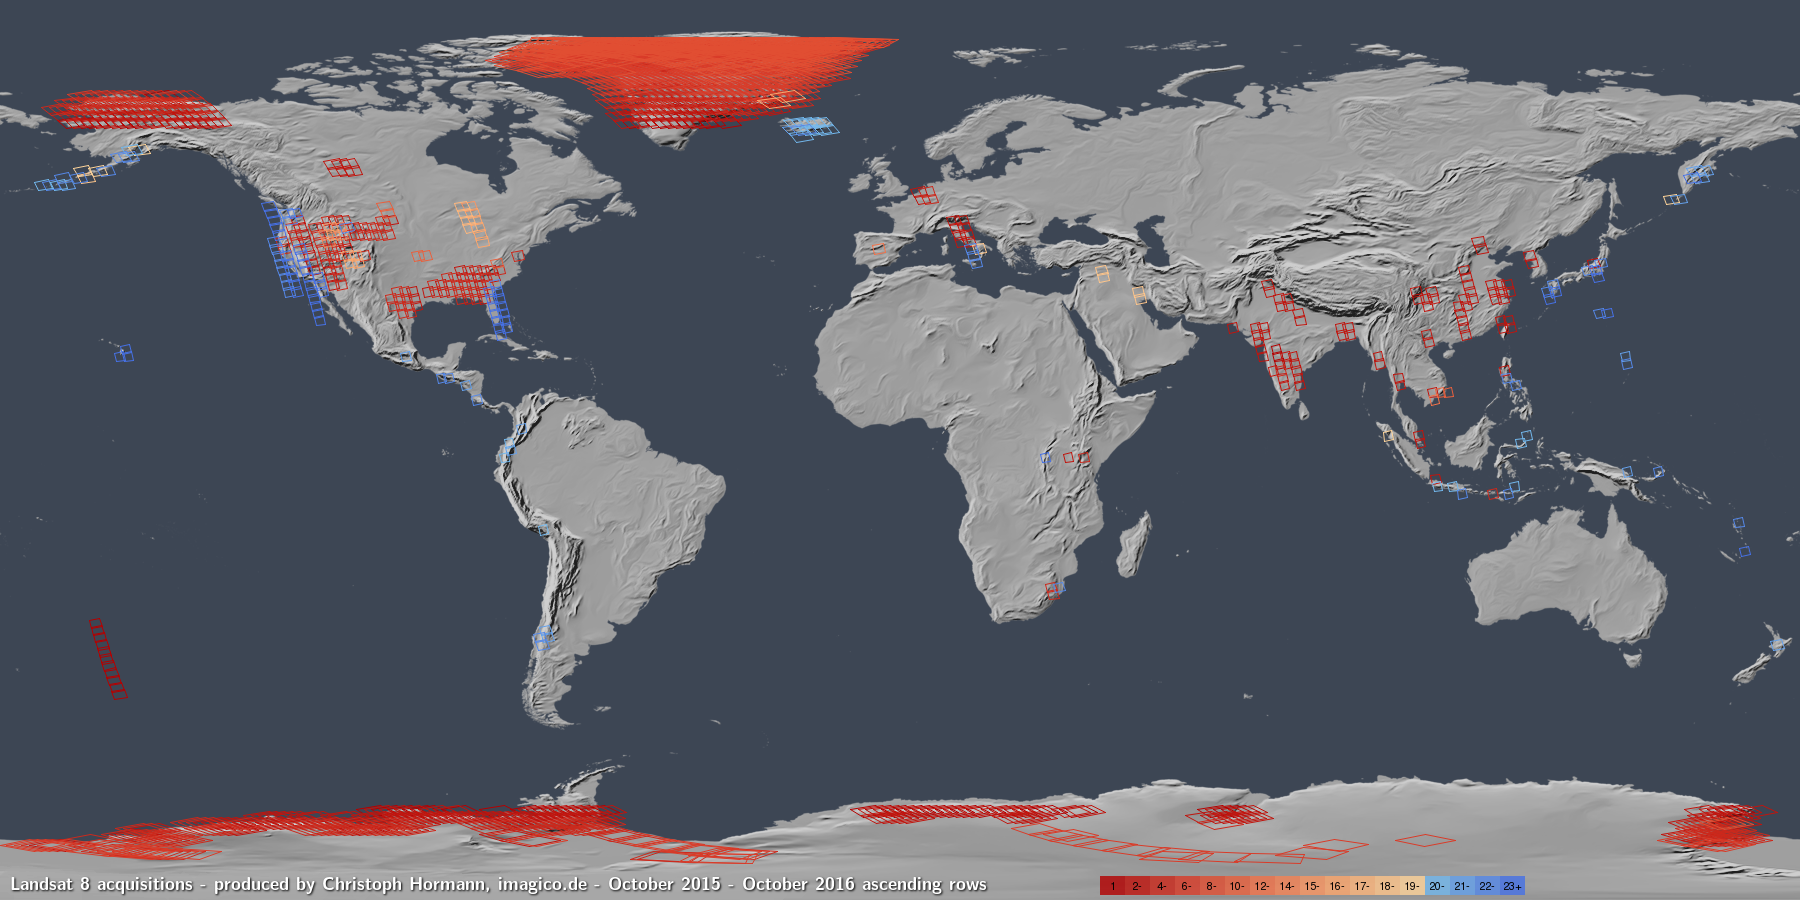
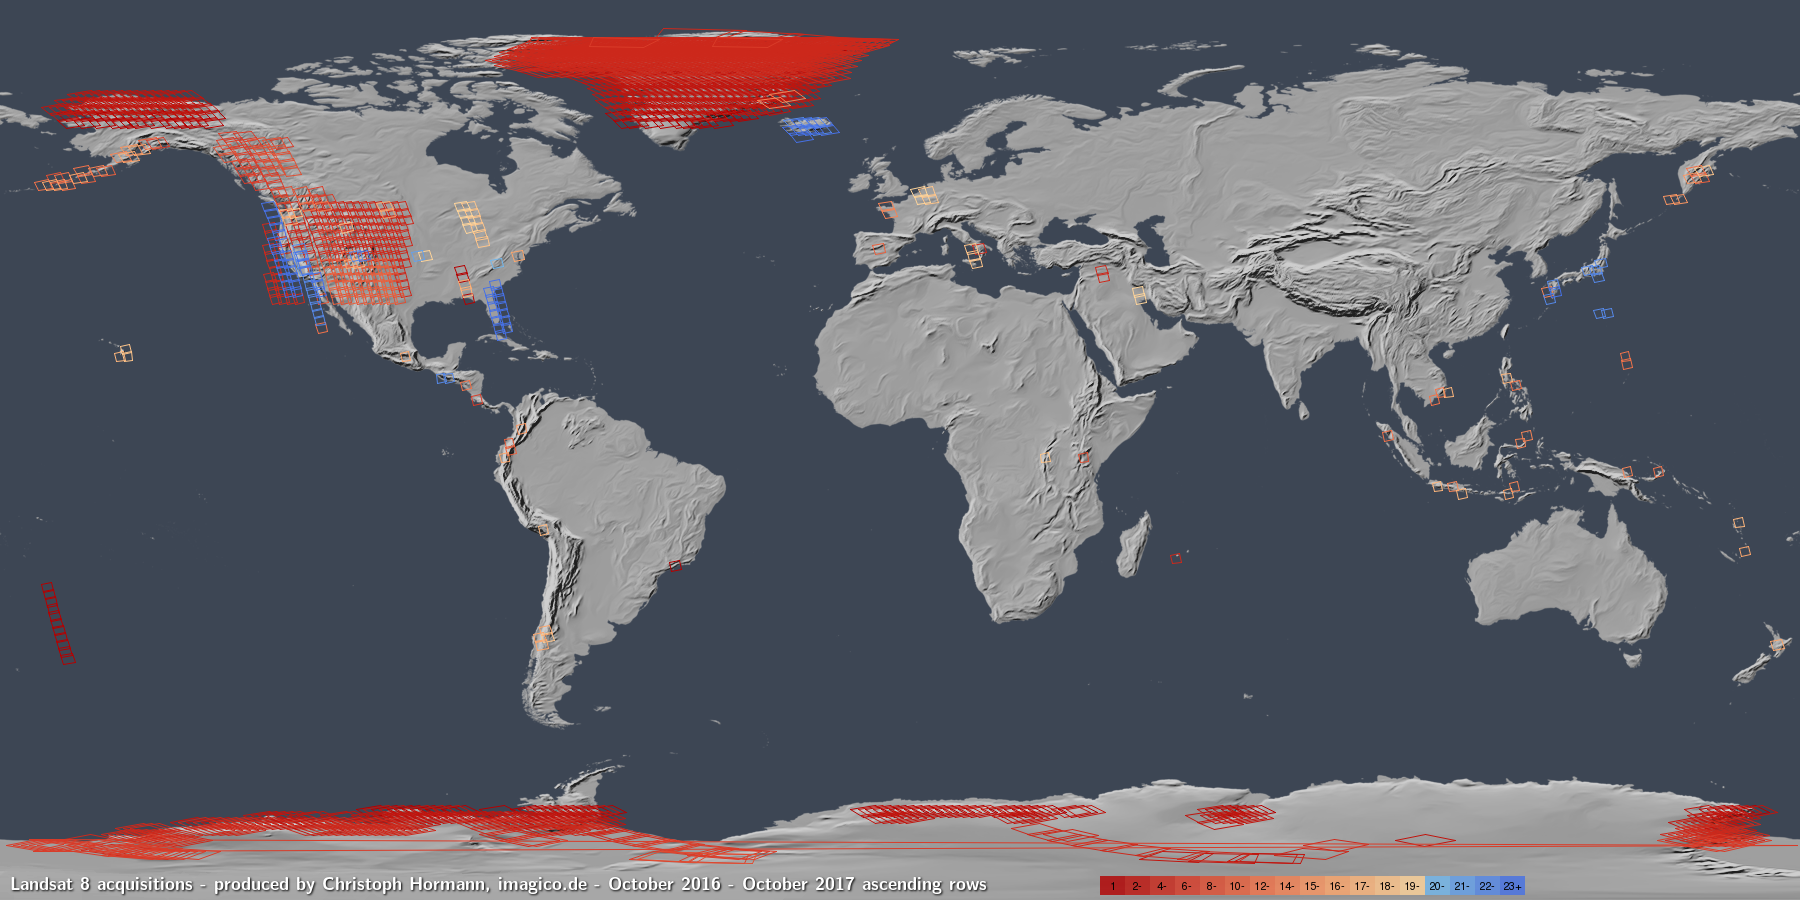
Here are the coverage maps for Landsat 8 day time acquisitions:


The most notable difference to previous years is that Antarctic coverage was significantly reduced during the 2016-2017 summer (see the last year for comparison). You can see that in the line plot on top as a dip in the Landsat 8 line near the end of 2016 which differs significantly from the patterns of the previous years. To my knowledge there has so far not been a statement from the USGS as to why this change was made.
Otherwise not much has changed – we now get routine off-nadir acquisitions for northern Greenland and the Antarctic interior. In Greenland these always happen for the same path which means there is room for improvement by selecting the path dynamically based on weather in the target area. All 2017 northern Greenland off-nadir images are severely affected by clouds.
Also we still have the two one gap in land area coverage at lower latitudes – Rockall and Iony Island (Edit: noticed there is actually one image for Rockall – though not regular coverage. Iony Island is actually the more meaningful omission)
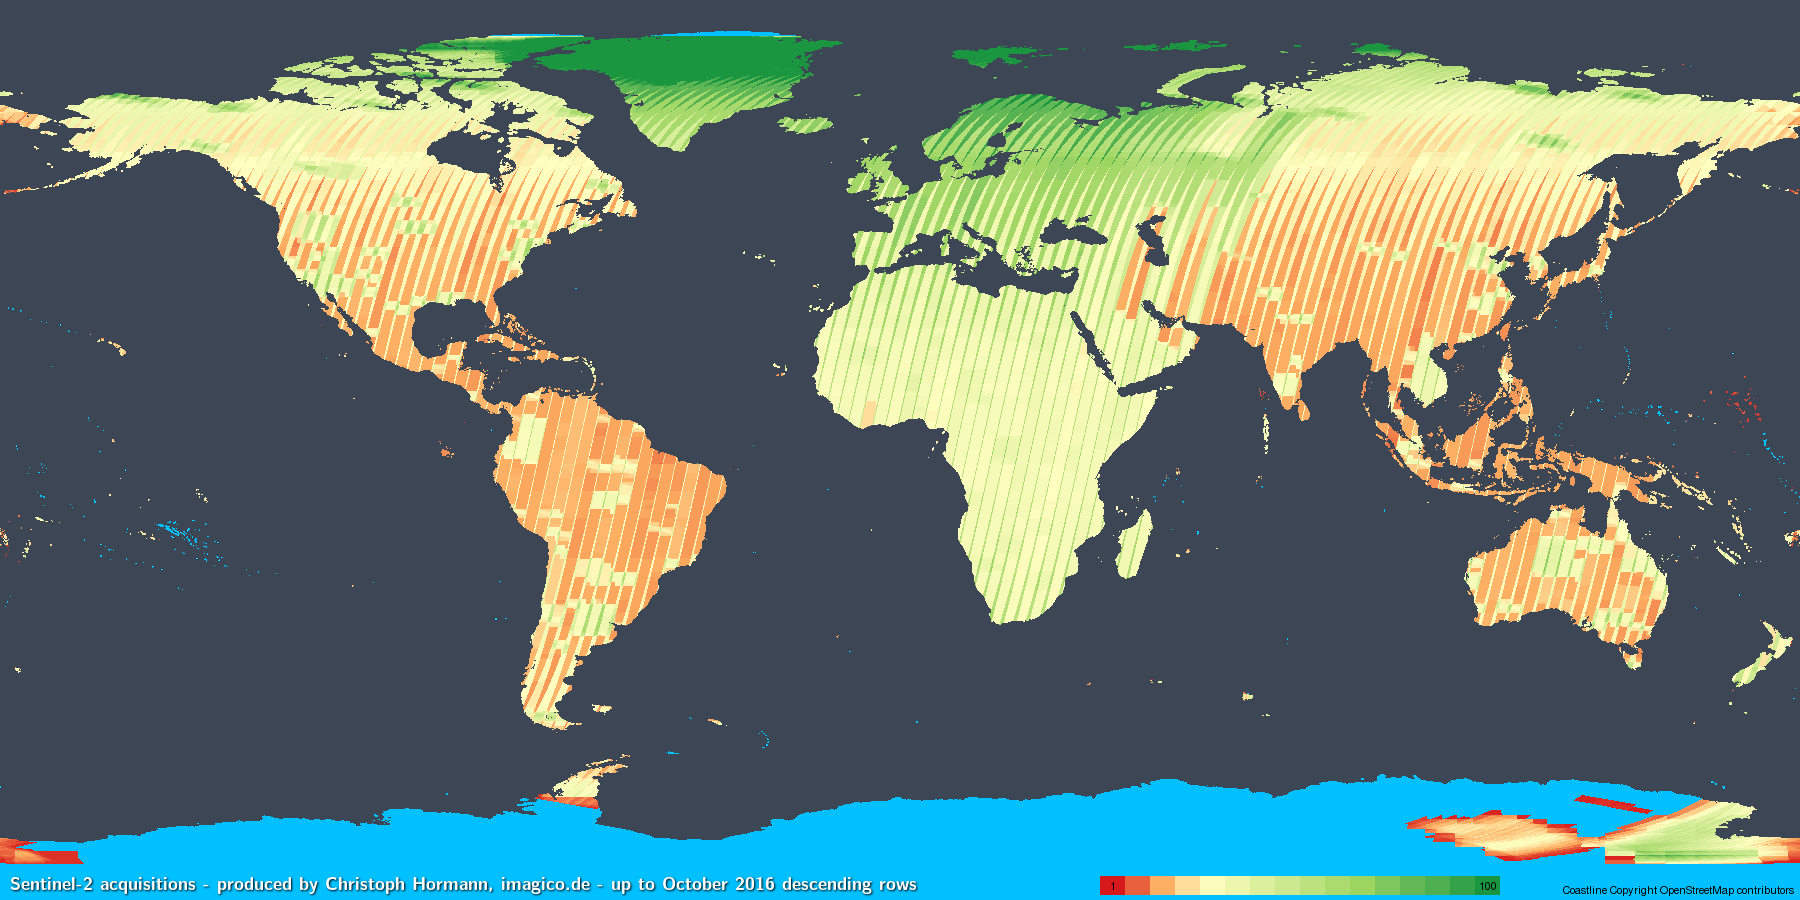
Sentinel-2
For Sentinel-2A we are looking at the second year of operations and this might lead to expectations of an increased level of routine and therefore reliability. We also get the first images from Sentinel-2B. Here are the numbers for Sentinel-2A and Sentinel-2B separately:


And here the combined numbers with a different color scale.

I should emphasize that these are the images publicly available. As pointed out already in a previous report there are significant differences between the published acquisition plans and the actual recordings and furthermore publication of images is frequently incomplete. Here an example from Sentinel-2B from my detailed statistics page (which i also updated to the current state).

I have not determined precise numbers but it is clear that the volume of both images planned but not recorded and recorded but not published is significant. Especially the latter, in particular in its arbitrariness shown in the image above, seems quite embarrassing.
The acquisition patterns are nearly the same as last year and also the same for Sentinel-2A and Sentinel-2B apparently. To summarize: Most of Europe and Africa as well as Greenland are recorded at every opportunity – which means a ten days intervals for each satellite, the rest of the larger land masses except Antarctica only at every second opportunity except for some seemingly arbitrary small special interest areas where also a ten days interval is recorded. Smaller islands are fully missing. Antarctica has been covered during the 2016-2017 summer but mostly at a much lower frequency than the rest of Earth.
Apart from the spatial distribution of acquisitions (which quite clearly is a conscious political choice) the most striking difference to Landsat is that high latitude acquisitions in Greenland and European Arctic islands are not reduced due to the naturally larger overlap between recording opportunities. In northern Greenland this leads during summer to frequently more than one image per day. While this can be nice for data users interested in those areas and is also kind of compensatory for the otherwise low focus on these regions it is fairly wasteful in terms of recording resources and probably results from blindly sticking to the rule record Europe and Greenland at every opportunity decided on by bureaucrats who have no clue what this actually means in practice.
Conclusions
So overall not that much has changed since last year – which i guess is good news for Landsat and less good news for Sentinel-2 since the latter is still subject to the same problems and limitations as last year. But maybe we just need a few more years to get used to these problems…
Apart from the problems already mentioned Sentinel-2 operations continue to be plagued by delays in data processing and other incidents. While for Landsat you can fairly reliably predict when the next image will be recorded for a certain place on earth and that it will be available a few hours afterwards for Sentinel-2 this is still much less the case.
With all the beating on Sentinel-2 problems it should however be mentioned that with two satellites now operating at a more or less constant level Sentinel-2 now usually offers a higher recording frequency than Landsat 8 (which is a practically sensible comparison since use of data from Landsat 7 is often fairly difficult due to the SLC gaps) – even in the lower priority areas – except for the small islands and Antarctica of course. In other words: if you look for the most recent image from a certain point on Earth it is more likely you find it in the Sentinel-2 archive than from Landsat 8 – despite the fact that delays in processing, missing recordings and missing publications put Sentinel-2 at a significant disadvantage.
And another positive thing about Sentinel-2 – Availability of the download infrastructure has improved a lot in the past months. Longer unscheduled downtimes where no downloads are possible at all are now fairly rare.
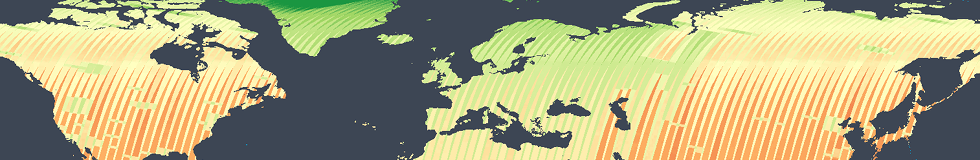
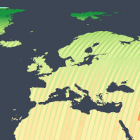
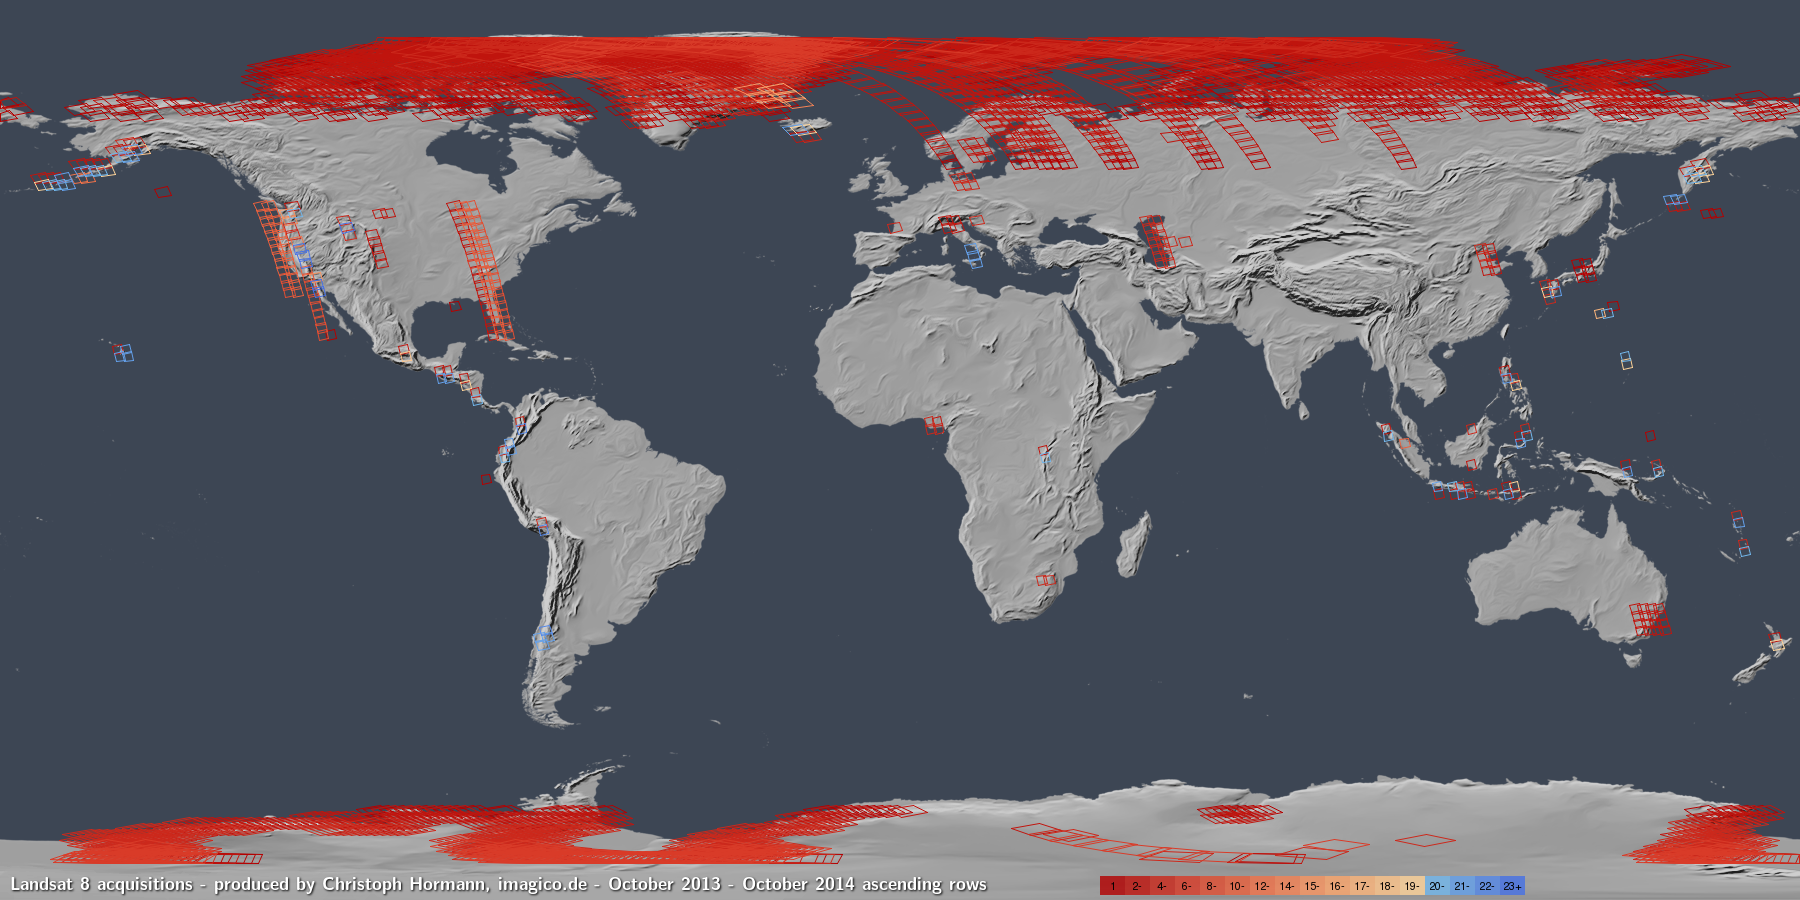
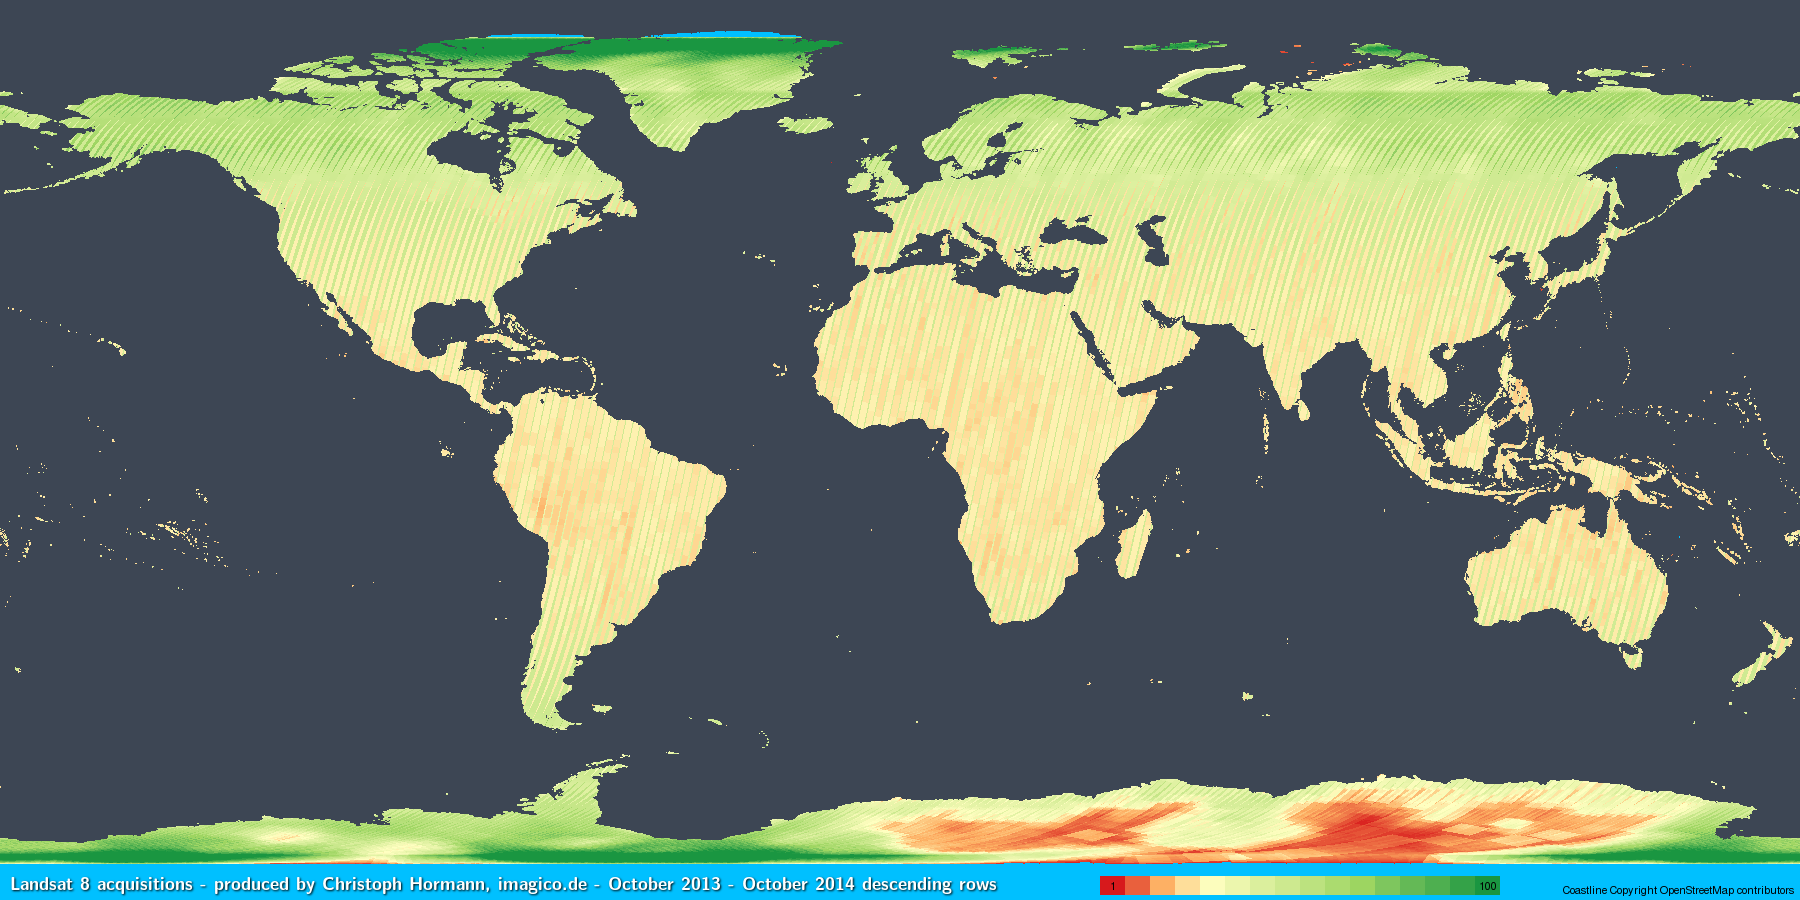
Here for reference all the recording visualizations for this and the previous years:
| year | day | night | day pixel coverage |
|---|---|---|---|
| 2014 | LS8, LS7 | LS8 | LS8 |
| 2015 | LS8, LS7 | LS8 | LS8 |
| 2016 | LS8, LS7 | LS8 | LS8, S2A |
| 2017 | LS8, LS7 | LS8 | LS8, S2A, S2B, S2 (both) |
And also see the detailed recording patterns per orbital period and the daily recording numbers.