It has been some time since i wrote about news in the world of open data satellite images and quite a few things have happened since then some of which i want to comment here.
Sentinel-2
Recently ESA published a report on the access to satellite data from the Copernicus program. This is mostly boring read with a fairly bad signal-to-noise ratio but there are also quite a few interesting things buried under a lot of meaningless all numbers have increased during the last year stuff. The most important thing to keep in mind if you read this is that the distribution form of the Sentinel-2 data changed to single granule packages during the reporting time frame. This is not properly taken into account so most numbers referring to package counts are nonsense combining apples and cherries so to speak. But to avoid misunderstandings – it is already quite positive that such a report is at least written and especially that it is published in the first place.
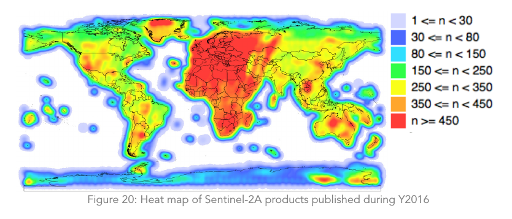
What is particularly funny is the following illustration meant to indicate the spatial distribution of published Sentinel-2 images.

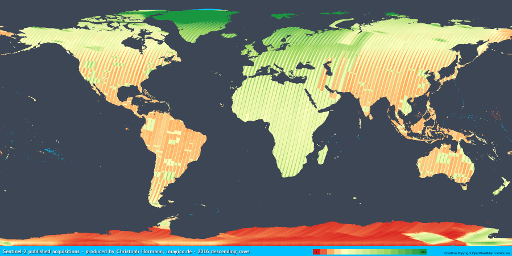
For comparison here the accurate coverage map (which i published earlier for a different reporting timeframe).
The ESA illustration is not only combining the single and multiple granule packages apparently, it also senselessly blurs the illustration – probably they had the same troubles producing an accurate visualization from their own inconsistent metadata as me. Overall great example how not to do a visualization.
Some interesting facts that can be extracted from the report are:
- a fairly open admission that availability of the open data access sucked beyond belief during the last part of the reporting time frame – something i already pointed out here. This is rationalized in the text of course. From current use of the service i predict that this will improve in the report for 2017 but the bar is not that high – they consider everything above 95% as good. And formal availability of the service as a whole of course does not necessarily means it is practically usable.
- some interesting numbers regarding the actual use of the download services. I will get to these in the following.
Use of Sentinel-2 data access
I will only discuss Sentinel-2 numbers here while the report also covers the other Sentinel satellites of course. The report also covers both the Open Access Hub available to everyone and the other data hub instances available only to certain privileged groups:
- the Copernicus Services Hub which is for organizations performing services inside the Copernicus program, i.e. stuff directly financed within the program.
- the Collaborative Hub which is for partner organizations within the European Union, in other words independently tax financed stuff.
- the International Hub which is for partner organizations outside the EU – which is currently one from Australia and two from the US (of either NASA, USGS and NOAA – which is not specified)
Now the main numbers: A total of 0.46PB of Sentinel-2 data has been published. Downloaded via the Open Access Hub by the general public were 1.53PB and via the other non-public access hubs were 1.14PB.
Of the downloads by the general public about 75 percent were data that was less than one week old, there were about 6500 registered users accessing Sentinel-2 data of which less than 100 downloaded more than 100 packages.
Now my interpretation of these numbers:
- The routine very large volume data users (think: Google, Amazon – but also various smaller ones probably) apparently do not get their data via these channels, they must have separate arrangements which are not publicly reported on.
- Independent data users with a larger volume of data use like myself are extremely rare. Almost all of the use via Open Access Hub is just testing a few recent images and no routine use. Of course this is the first year of operations and people just start getting interested. And naturally the frequent changes in data format and the bad reliability of the systems does not really encourage use and especially smaller data users will likely wait if this stabilizes and use alternative data sources in the meantime.
- If there is significant large volume access to the Sentinel-2 data from the partner organizations through these channels it must have started relatively late in 2016 since overall numbers likewise suggest mostly limited volume use.
Some additional data
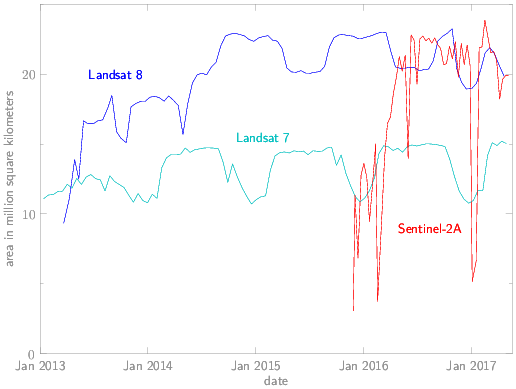
Here some additional illustrations based on the publicly available metadata which are not in the report and which are also not widely discussed otherwise. First the development of published image volume in terms of covered area with Landsat in comparison.

average daily acquisition volumes of open data satellites
Note this is not a hundred percent accurate due to the difficulties of accurately calculating it from the available metadata. But it is pretty close. The volume is always calculated per orbital period, the repeat cycle of the orbit pattern which is 10 days for Sentinel-2 and 16 days for Landsat. The numbers are then normalized to a daily volume for comparability.
What you can see is that Landsat 8 has been recording on a relatively stable level since 2014 between about 20 and 23 million square kilometers per day. There is a seasonal pattern due to the variation in illumination of the earth land masses. Landsat 7 follows a different pattern on a lower overall level with a minimum in the northern hemisphere winter since it does not record the Antarctic. If you look closely you can also see a drop in last winter in the numbers of Landsat 8 which comes from the Antarctic coverage being limited in the 2016/2017 season mostly to coastal areas for some reason. I could not find any documentation of this in the USGS materials and I hope this is a one time incident and will not mark a permanent change in the recording patterns.
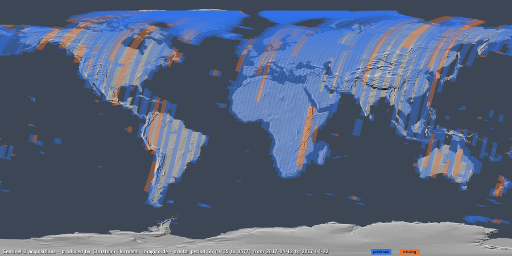
Sentinel-2 numbers are meanwhile on the same level as Landsat 8 in terms of overall coverage volume but the numbers are much less stable with many irregularities and gaps. This brings me to the next thing i prepared – which is a visualization of the coverage by orbital period indicating the images available as well as those missing – images which were planned to be recorded according to the published plans but which are not available for download – either because they have not been acquired or because they are not processed.
It should be noted that the way acquisitions are planned differs strongly between Landsat 8 and Sentinel-2. Landsat 8 has a dynamic acquisition system based on predefined scene priorities that leads to an automatic short term selection which scenes are recorded based on a large number of influencing factors and the resulting acquisition plan is usually very close to what is actually recorded and then also available. Sentinel-2 in contrast to that is operated with a fixed acquisition plan set long in advance.
In any case what can be concluded from this is that there are significant derivations of actual operations of Sentinel-2 from the published plans and the recording numbers (in minutes per orbit) listed in the mission status reports are not actual recording numbers but just what has been planned. I am not sure if those gaps which are clearly missing recordings are due to the acquisition plans overbooking the satellite and data transfer systems or if there are outages in components of the data transfer system or operational errors. The missing recordings are too frequent to be purely due to operational contraints like orbital maneuvers, calibrations etc.
In addition gaps in processing with individual granules missing are fairly common and these do not get filled after a few days as you might expect. If these would be filled by later reprocessings of the images is an open question. This seems to be a side effect of the move to single granule packages – i never experienced individual granules missing with the larger packages – paired with a lack of fault tolerance and error checks in the processing system.
Last i also fixed the daily scene numbers page which had not been working correctly for quite some time. These numbers are now also normalized area coverage numbers.
With the whole thing it is of course important to keep in mind that the spatial resolution of Sentinel-2 imagery is higher than that of Landsat so the data volume for the same coverage area is naturally significantly larger.
Landsat
I kind of fear that with ESA getting all screen time here with critical commentary the USGS might get jealous so here also a few words on Landsat (although i already had a bit of analysis in the previous paragraphs).
Transit to the new ”Collection” distribution form for Landsat data is now complete. As mentioned previously this is a fairly superficial change for most data users. The USGS also continues to use the old scene IDs in their data management system at several places – for example the metadata pages still have the form
https://earthexplorer.usgs.gov/metadata/12864/LC81920272017130LGN00/
The most significant shortcoming from my perspective is however that the bulk metadata they make avilable is apparently incomplete – at least for Landsat 8 there seem to be more than 3000 scenes missing in the Collection data set which are in the old legacy database. This appears to be a problem of the metadata file though – the scenes appear to be available in EarthExplorer.


