
Digital elevation data is an important basis of map production and geodata processing these days. I have written about elevation data sources and use of such data previously on several occasions. SRTM data is the most widely used elevation data set (likely even the most widely used geodata set in total) and people often complain about its limitations, in particular the limited resolution and the data not properly representing the ground elevation. What they sometimes forget is that apart from these aspects and the well known gaps in coverage this data is of quite exceptional quality and uniformity otherwise.
It might appear at the first glance that data quality beyond the basic aspects of resolution and accuracy should not be an issue with digital elevation data at all but once you work with such data from different sources you quickly realize this is not the case. Historically one of the major quality issues of elevation data sets has been poor conversion from contour data to a gridded representation. In the pre-SRTM age and in the years afterwards this was a problem for almost all other elevation data sets. This is gradually getting less important as automatically produced data sets, like based on LIDAR and automatic photogrammetry, are replacing countour map derived data. But these are not free of problems either.
Here an example from a data set of the Italian region of Veneto. The data is available under IODL2-license in 5m nominal resolution. At first glace this seems good quality data but when using it for 3d visualizations i got the following results.

Now the type of 3d views i produce is an extreme test case for this kind of artefact. Regular structures in the data are visible even if only of extremely small intensity. The steps you see are at most a few meters in height. You can also see them at close inspection in a normal 2d view but they are definitely not significant in terms of absolute accuracy. But they are a problem in many applications, they can of course also turn up in a 2d shaded depiction.

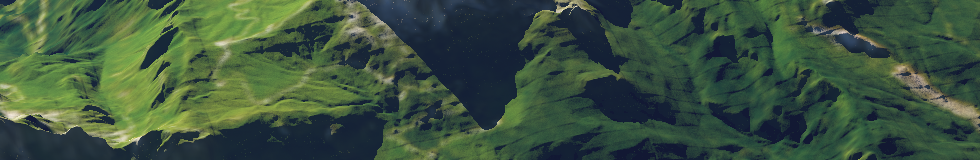
Filtering out these kind of structures is possible to some extent but it is quite some work to do so. Here the results in 3d:

I won’t make available the filtering tool since it is too specific for more general use but if you are interested in the improved Veneto elevation data set let me know.
Apart from artefacts there are a number of other frequent issues you have to deal with in many local elevation data sets, like:
- Differences in geoid/elevation value calibration. Most data sets contain elevation values above sea level but this does not always mean the same thing. Combining different data without taking this into account will result in visible steps.
- Lack of proper marking of no-data areas. Often missing data is simply indicated by zero values which makes it difficult to distinguish between data gaps and real zero elevation.
- Data sets made available only with integer meter values.
Overall having elevation data of nominally good quality and with a usable license for your target area is usually only a small part of the work required to get good results in a map or 3d view.