
In this series of blog posts (see part 1 and part 2) i have so far discussed the limitations of current digital map design frameworks regarding the use of line signatures compared to what was state of the art in the pre-digital age. And i provided some examples of what design issues result from the technical constraints we are faced with and showed various methods that can be used to work around these technical constraints to some extent.
All of this was so far about either constant or periodically repeating line signatures. Here i want to show that this is not the end of options to use line signatures in maps. Like the previously discussed designs this is also available in the AC-Style for everyone to use and study.
The feature i am going to look at here is crevasses. Crevasses are so far not a very widely mapped feature in OpenStreetMap, they are kind of a niche interest only relatively few mappers work on. This is partly because mappers sometimes think that, since individual crevasses are very volatile, it is pointless to map them. They often don’t realize that, while individual crevasses move and change fast, the location where and the patterns in which they occur in are typically very stable, often much more stable than the extent of the glacier itself. Mappers who map crevasses in OpenStreetMap use both polygons and linear ways to map these and both can be reasonable choices depending on circumstances. For providing constructive feedback it is therefore prudent that a rendering solution ensures a decent depiction of both variants.

Crevasses in the Antarctic
Crevasses are an interesting and challenging element in map design because they occur in a very broad range of sizes – the width of a crevasse can be from less than a meter to dozens of meters and the length from a few meters to many kilometers. And – as already hinted at – they form complex and in most cases fairly stable patterns that are often highly characteristic and significant for navigation on the glacier.
Because of this, rendering of crevasses is an important element in many traditional maps of glaciated regions and many techniques have been developed to depict crevasses at different map scales. Here are a few examples:

Crevasses in Swiss 1:25k topographic map

Crevasses in French 1:25k topographic map

Crevasses in Soviet 1:50k topographic map
For the design concept i am going to present here i took cues also from early modern maps of the Antarctic, in particular:

Australian 1:100k Aker Peaks from 1966 – source

New Zealand 1:250k provisional edition Cape Hallett from 1967 – source
The basic high zoom level design for single crevasses represented with polygons and linear ways is shown here (together with the other linear features common in this context – see the previous post)
It uses a relatively simple line pattern as the main component – but not on the linear way representing the crevasse, but on a constructed geometry in the form of an open crack along the line of the crevasse, tapered towards the ends. The width in which this geometry is drawn depends on the zoom level, the length of the crevasse and potentially the tagged width. The level of detail of the drawing (with line pattern on the outline or simple constant width line, with center-line or not – or even just a simple center-line) depends on the drawing width.
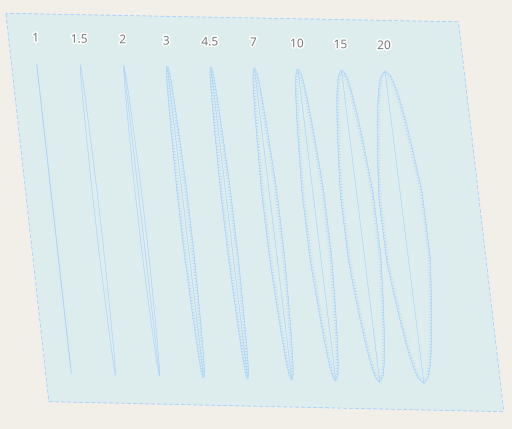
Crevasse ground unit rendering based on tagged width at z18
The real key to a harmonic design, however, is how crossing crevasses and combinations of polygon and linear way mapping are drawn. This is shown here:

Rendering of intersecting crevasses at z18 (link shows double resolution version)
So far, most of the crevasse mapping in OpenStreetMap makes relatively limited use of these options. Here are a few examples:
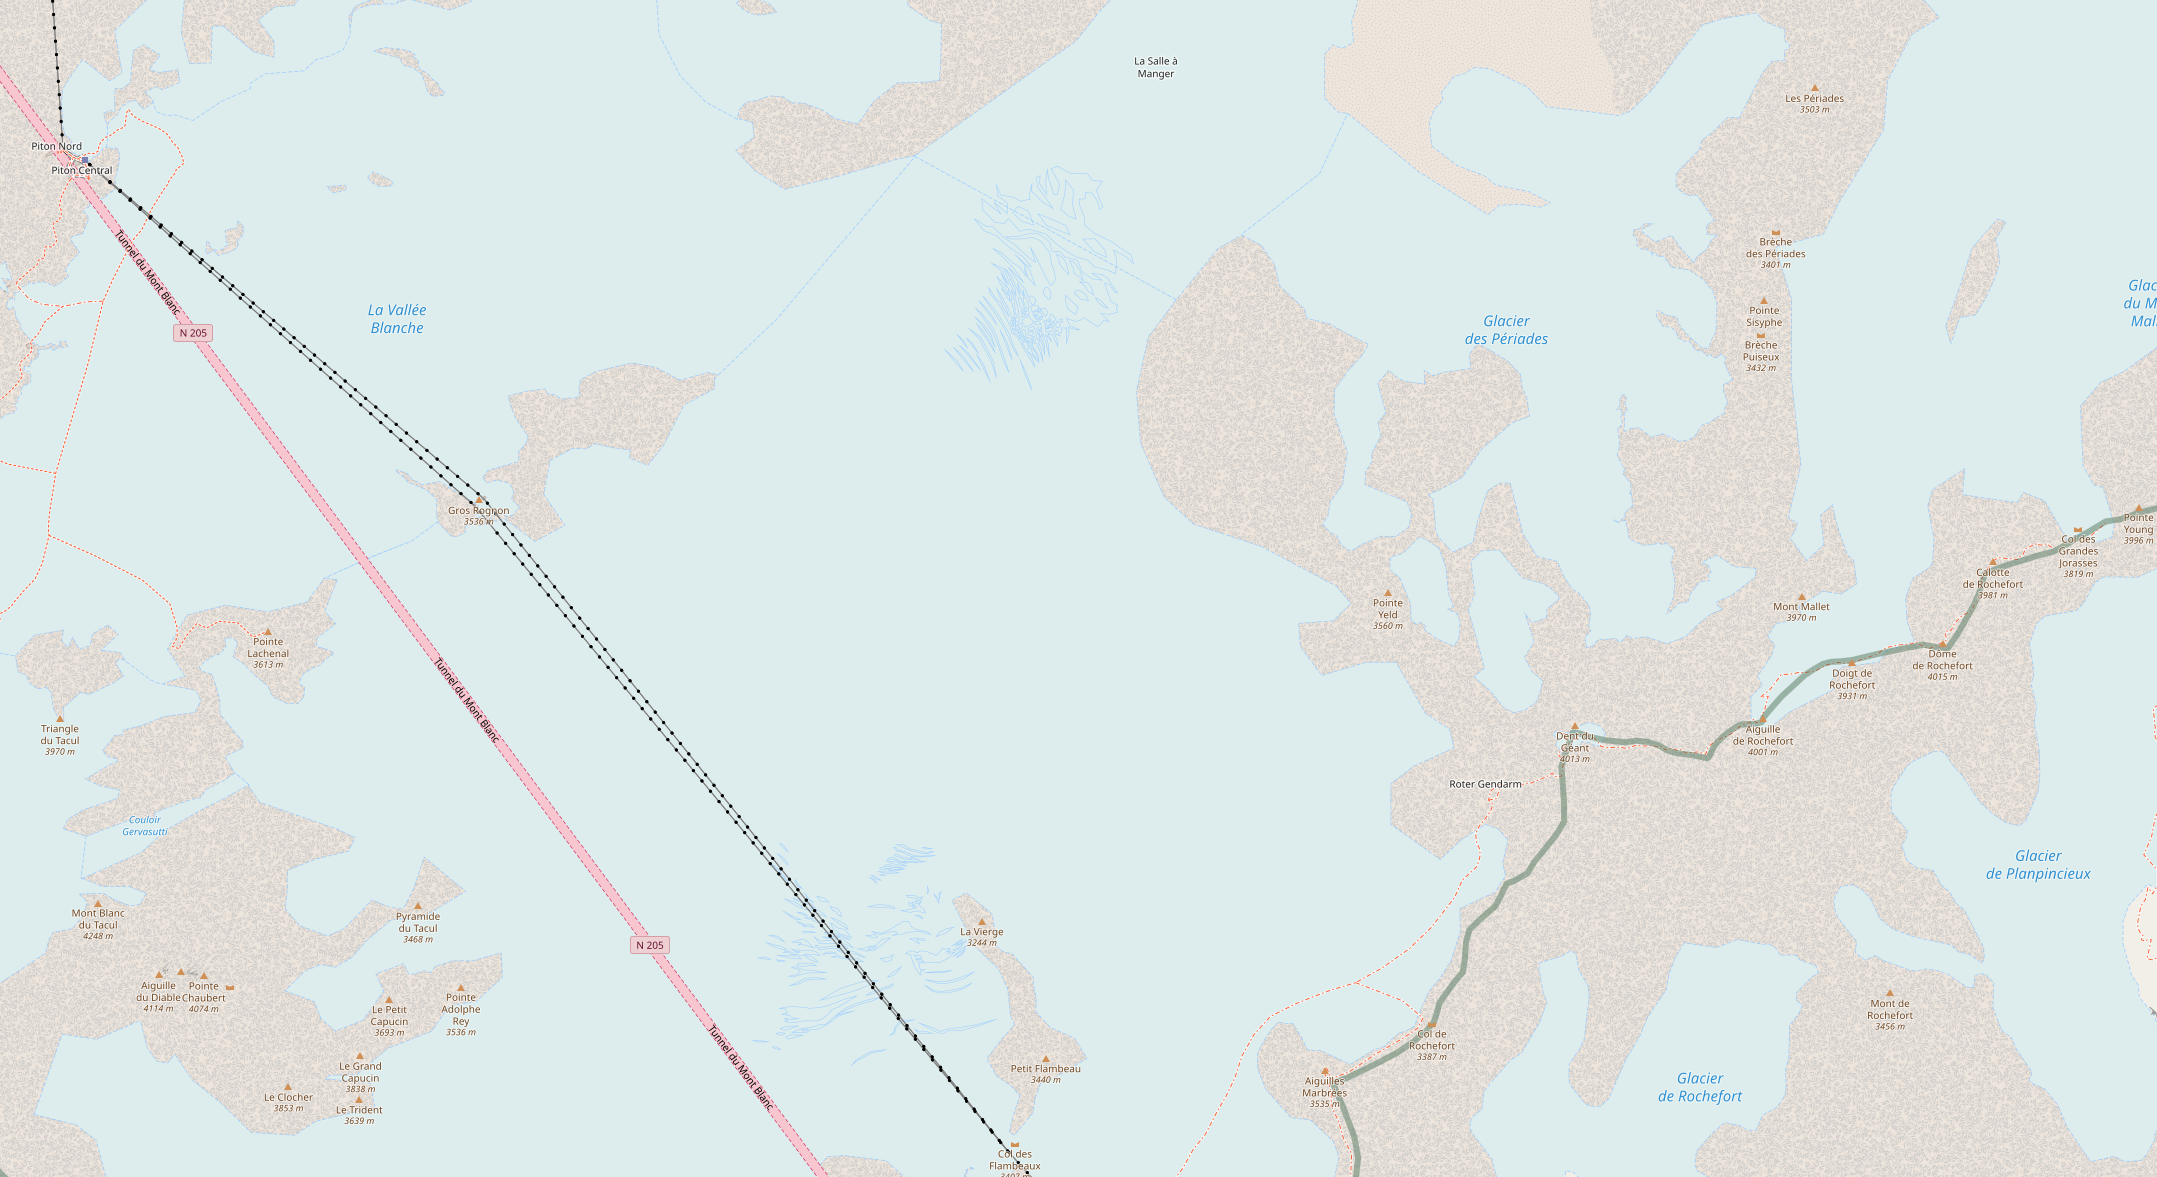
crevasses mapped with polygons – Séracs du Géant at z15

crevasses mapped with polygons – Séracs du Géant at z16

crevasses mapped with linear ways – Ghiacciaio del Dôme at z16
Conclusions
What i have shown here with the crevasses is an intermediate design approach between the use of higher level features discussed in the previous post and the fully manual drawing of line signatures as i have shown it for tree rows in the past. It uses manually constructed geometries but visualizes them with the help of line patterns. Practical usefulness of this based on OpenStreetMap data is so far rather limited due to the very patchy mapping of crevasses in OpenStreetMap.
Pingback: weeklyOSM 676 – weekly – semanario – hebdo – 週刊 – týdeník – Wochennotiz – 주간 – tygodnik