

I am pleased to here introduce a new satellite image product that i have been working on for a few months. Development of this has been co-financed by Geofabrik. They are going to offer tile services for web maps based on this image in combination with the Green Marble.
Background
Most of the readers of this blog will be familiar with the Green Marble – my global satellite image product offering the highest quality rendering of the whole earth surface available at a resolution of 250m. The Green Marble is produced with a pixel statistics approach, that means an analysis of all observations available is done independently for every pixel of the image to estimate the surface color at this point. This kind of technique is very popular because of its principal simplicity and because processing can be implemented in a very efficient fashion.
But this method has two main disadvantages:
- It requires a significant amount of data to actually get to a point where the final product is in visual quality equal to or better than an individual good quality image. How much depends on the algorithm used and its convergence characteristics and obviously this will differ a lot between different parts of the planet. For the Green Marble version 3 for example about 1PB of raw data was processed – which means more than 100kB of data per pixel.
- It does not scale well with increasing spatial resolution. I discussed this matter in more depth already back in 2018. This has multiple underlying reasons, the one that is most straight away to understand is that the higher the spatial resolution is you are looking at the more volatile the content of an image becomes. This mean the higher in terms of spatial resolution you go the less you have – on average – a long term stable state of the Earth surface your pixel statistics can converge to.
Long story short: Pixel statistics work very well at a resolution of around 250m if you have a large data basis to work with. They work poorly at much higher resolutions, even if you have a lot of data (which you typically don’t – but that is a different issue). This has not prevented various companies over the last 5-10 years to invest substantial resources in naively trying pixel statistics approaches on Landsat and Sentinel-2 data – with the expected mediocre results.
The alternative to pixel statistics for aggregating satellite imagery into a homogeneous larger area visualization is using classical mosaicing techniques where individual images are essentially put together in the form of a patchwork or mosaic. If you want a concise definition: You have a classical mosaicing techniques when the color at any point in the image is in most cases (a) primarily derived from a single source image and (b) the surrounding pixels are primarily derived from the same image. This is evidently not the case for a pixel statistics process where the processing of a pixel is not correlated to that of its neighbor.
Classical mosaicing techniques are the dominant method for aggregating very high resolution satellite and aerial imagery and for high quality images based on Landsat and Sentinel-2 data. The problem here is that achieving good quality with this approach requires fairly complex processing techniques and there are certain key steps that are notoriously difficult to automatize because the quality of the results depends a lot on competent human judgement.
Hence most satellite image based visualizations using classical mosaicing techniques either are relatively poor quality (high cloud incidences, poor consistency in colors across the seams between images) or are based on fairly old data because updates are costly.
I myself have been producing images using classical mosaicing techniques for nearly 20 years now (an early discussion of this can be found on this blog in 2013) and both improved and streamlined the methods i use over the years. But also for me hand work was so far always a key component in production of these images and as a result in many cases updates are very costly to do. Therefore i had been looking for some time at strategies to eliminate the remaining manual processing steps in the production of my higher resolution mosaics without sacrificing too much in terms of quality. With the help from Geofabrik i was now able to practically implement and evaluate some of these ideas and here i am going to present and discuss the results.
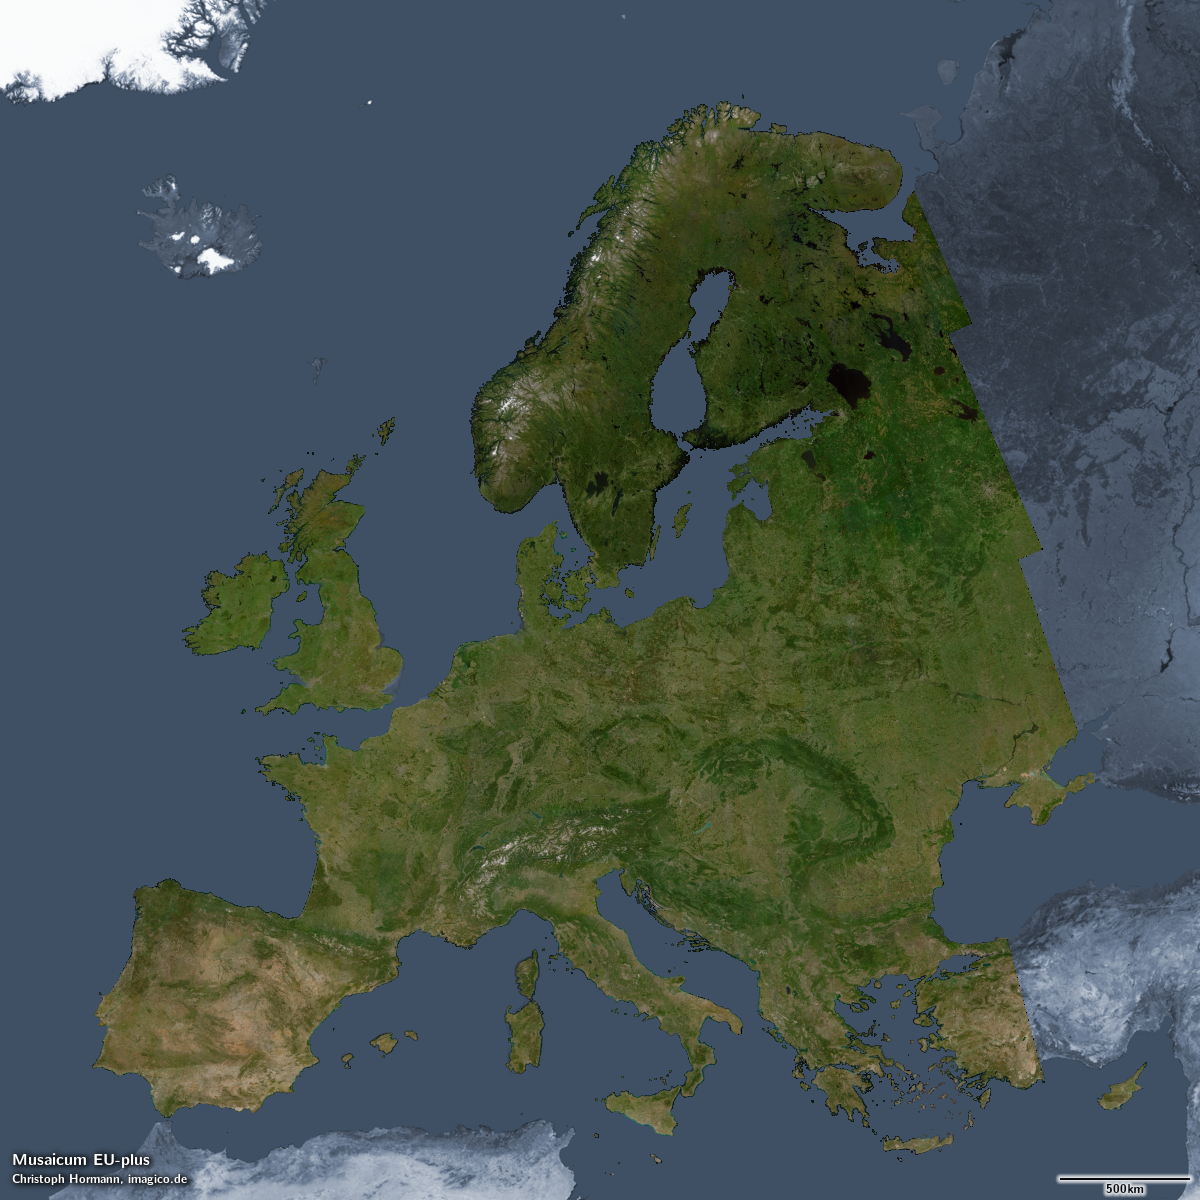
The Musaicum EU-plus – click for larger version
The image
At low resolution the image looks very similar to the Green Marble – which is not astonishing since it is assembled with the same aim – to depict the local vegetation maximum and snow minimum. If you look closely you can see the appearance is not quite as uniform as the Green Marble – with some inhomogenities that are clearly non-natural. Part of this is due to the low volume of data used (put simply: Not everywhere was there a source image available in the time period used that exactly represents the vegetation maximum). Another part is that there is still room for improvement in the data processing – after all this is a first attempt.
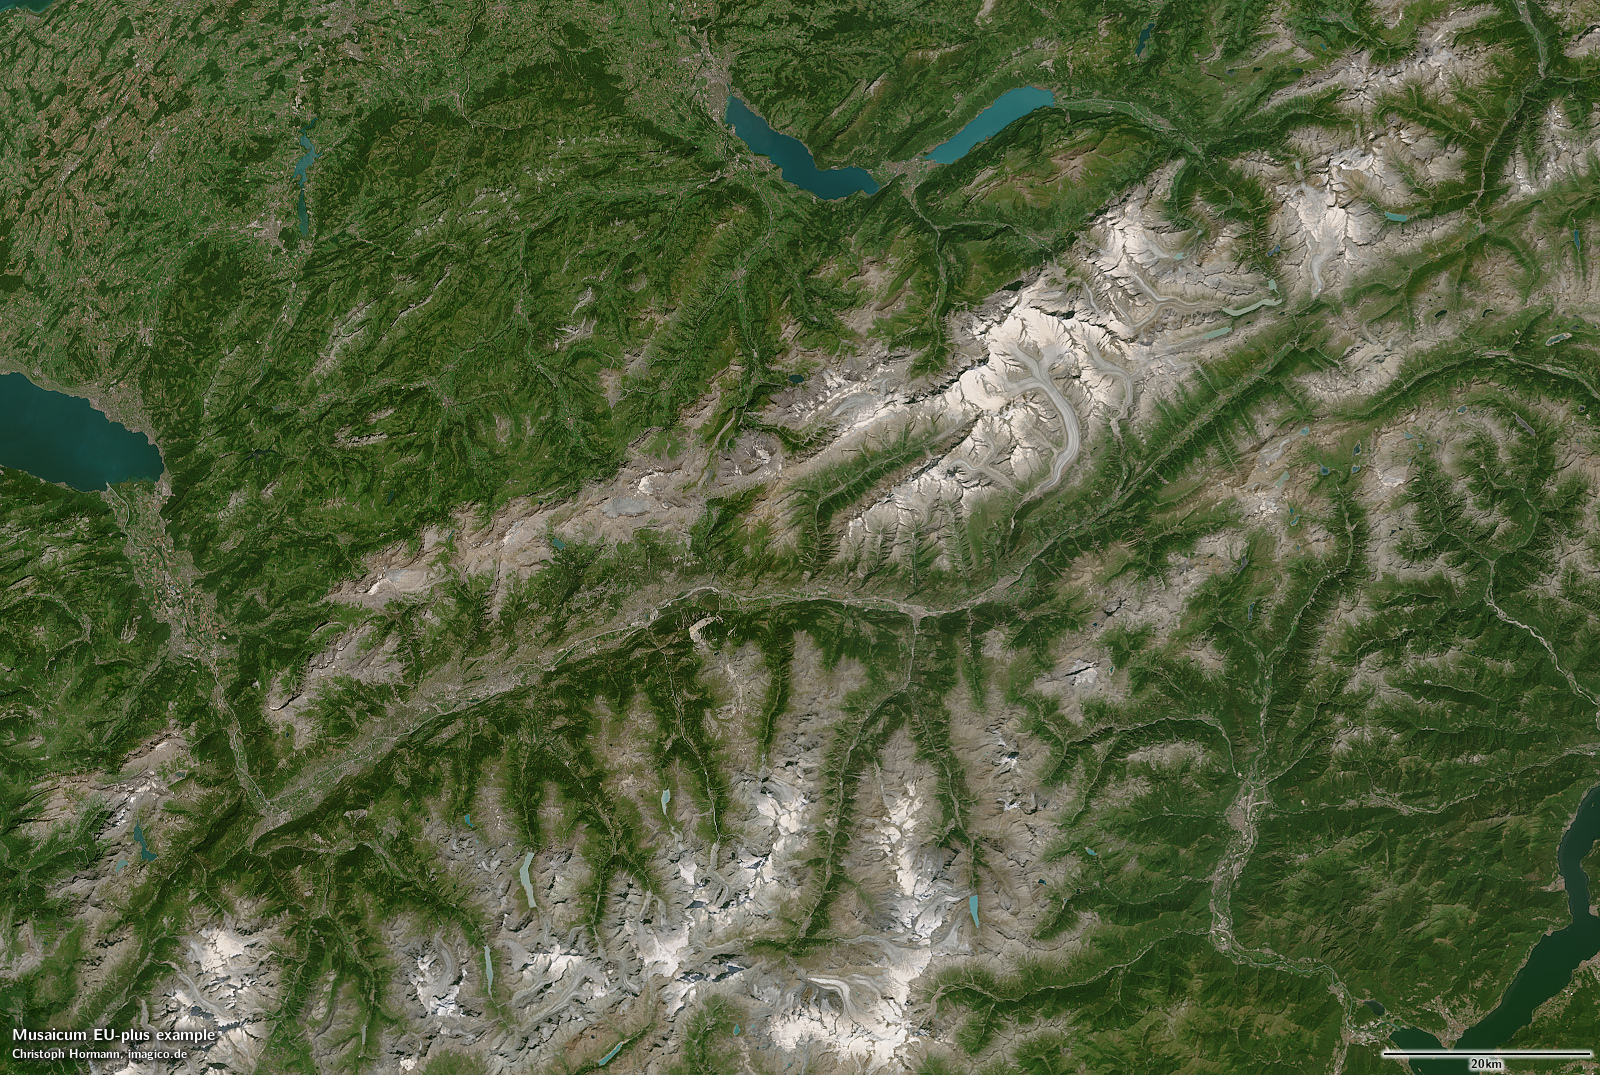
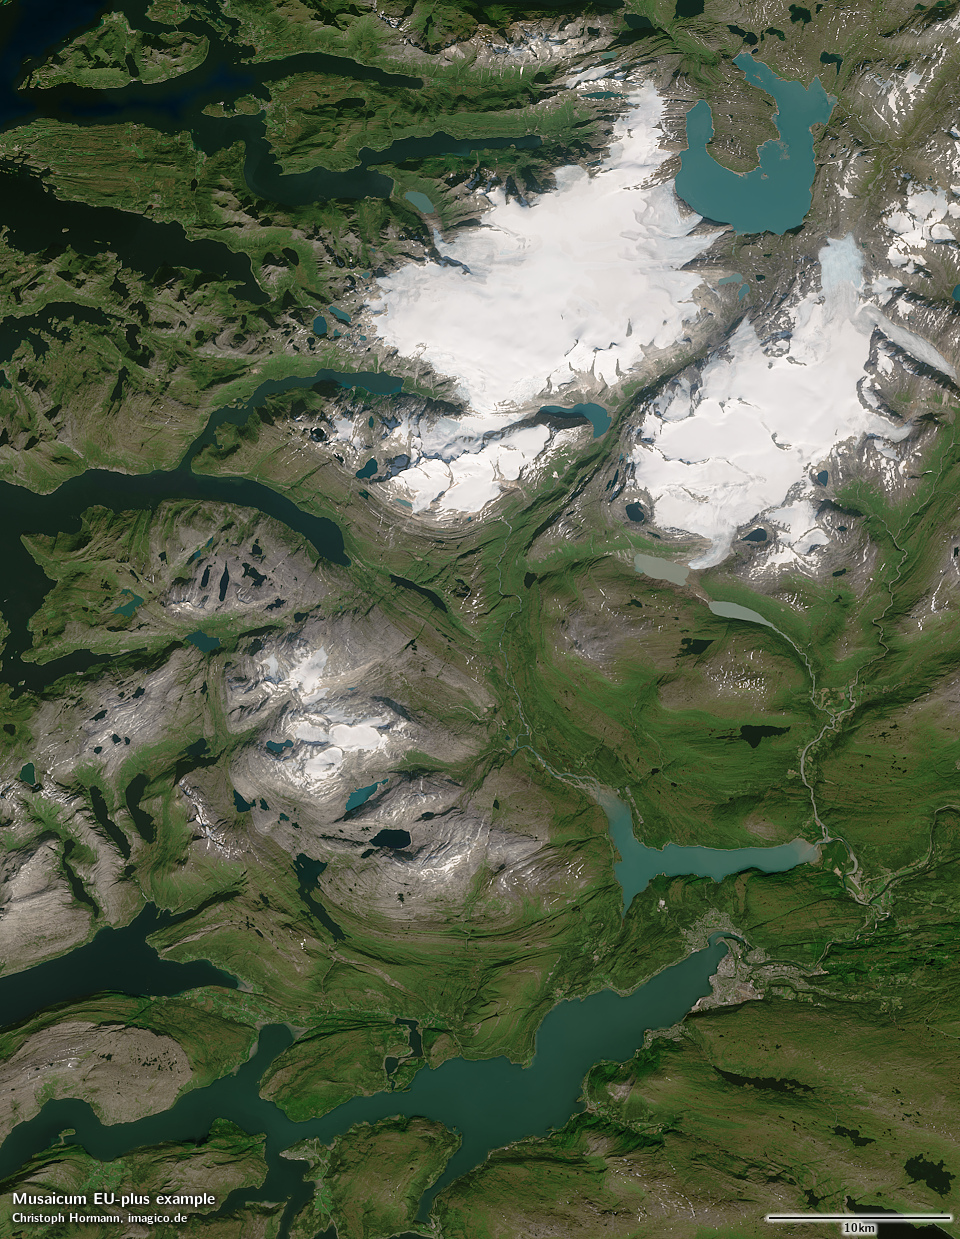
Swiss Alps
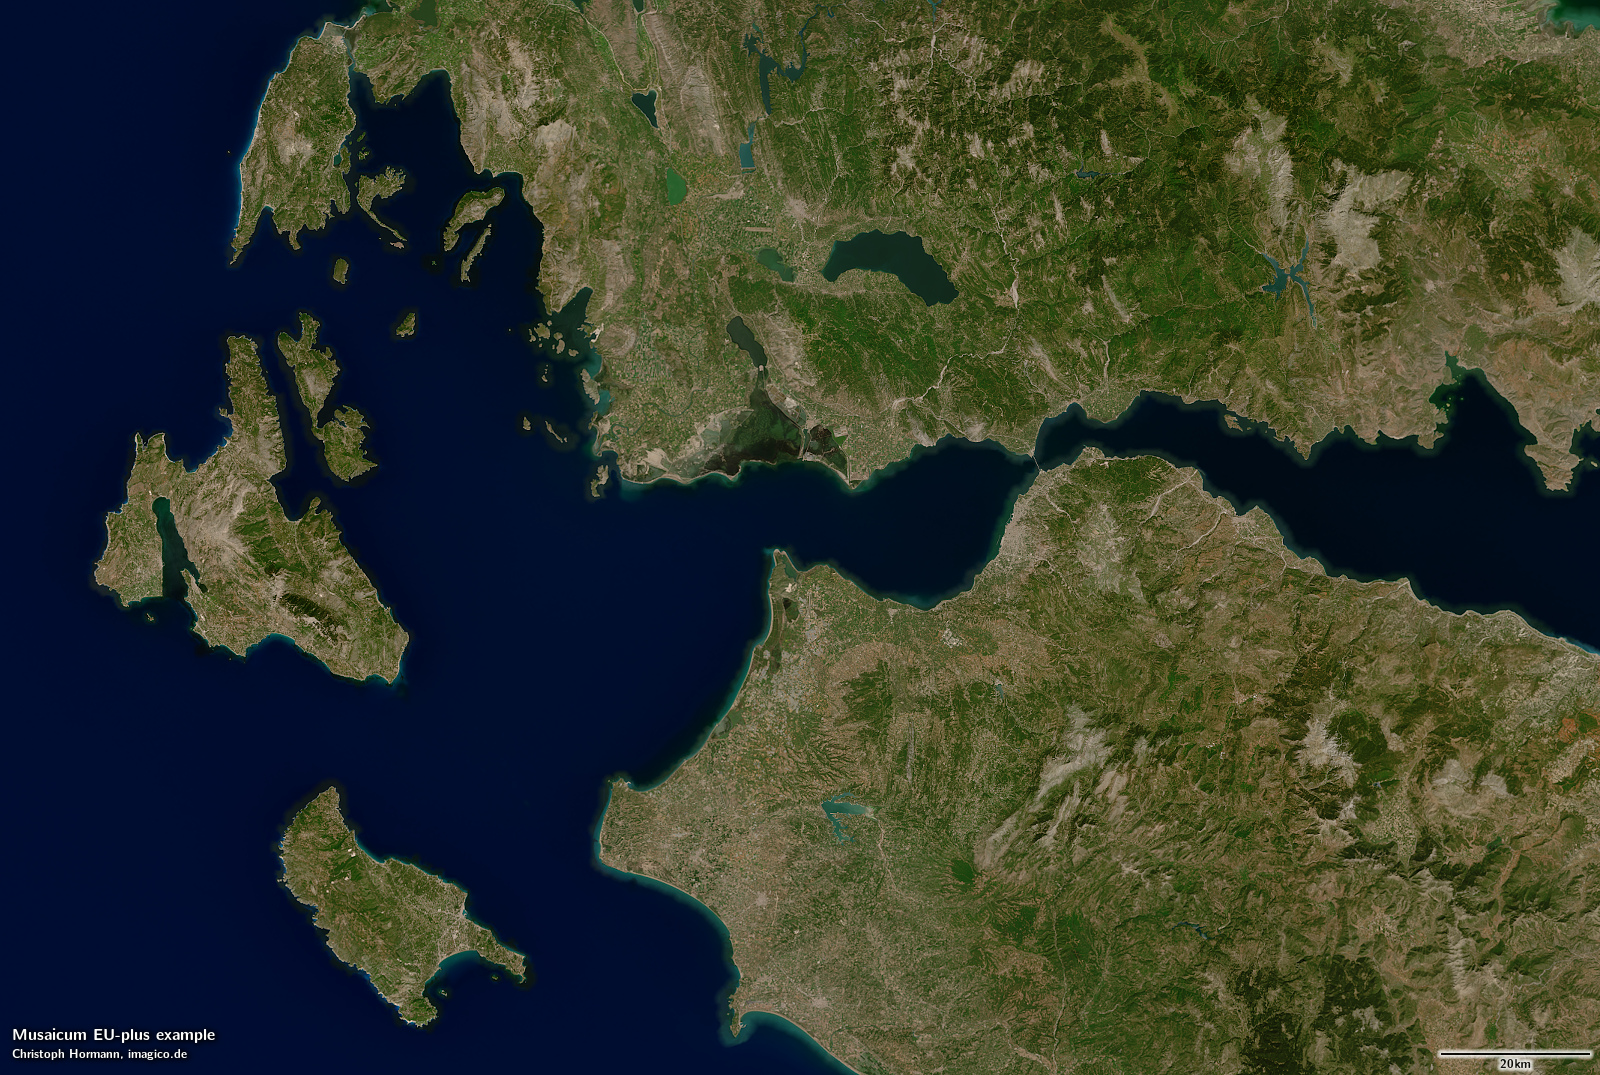
Western Greece
What you will quickly notice if you look through the sample images is that there are no clouds (or almost none – with very keen eyes you might spot a few, and yes, if you systematically screen the whole image you will find some more). This is a point where the results substantially exceeded my expectations. I was hoping to accomplish a cloud incidence substantially better than what is available on the market otherwise but i was expecting it to be significantly worse than in my manually produced local mosaics. The ultimate result is pretty much at par with the manually produced local mosaics with less than about one in 100k pixels severely affected by clouds. Most of these are small, isolated convective clouds.
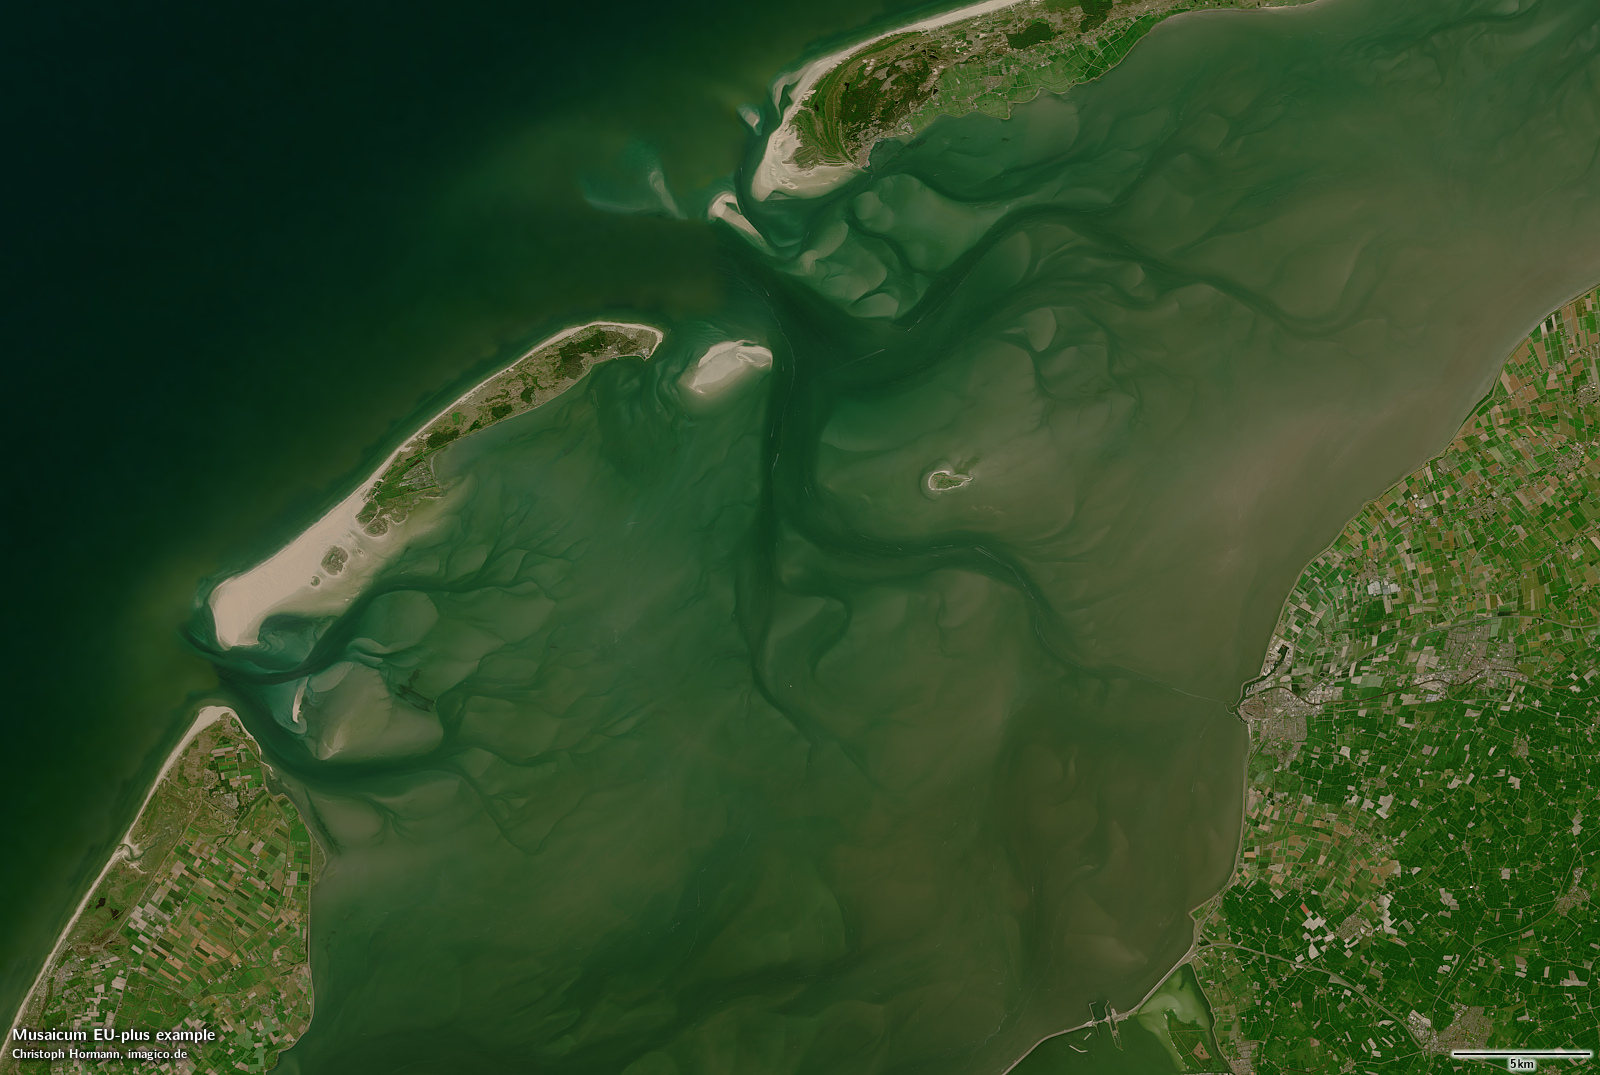
Vlieland, Netherlands
The focus of the project was on land area visualization so water surfaces were not a particular concern. Since waterbodies tend to be quite variable in appearance and often not in a strict seasonal pattern, the results in that domain are not always ideal, in particular rivers often change in coloring along their course quite erratically. Sun glint is also a problem at lower latitudes, in particular on smaller lakes.
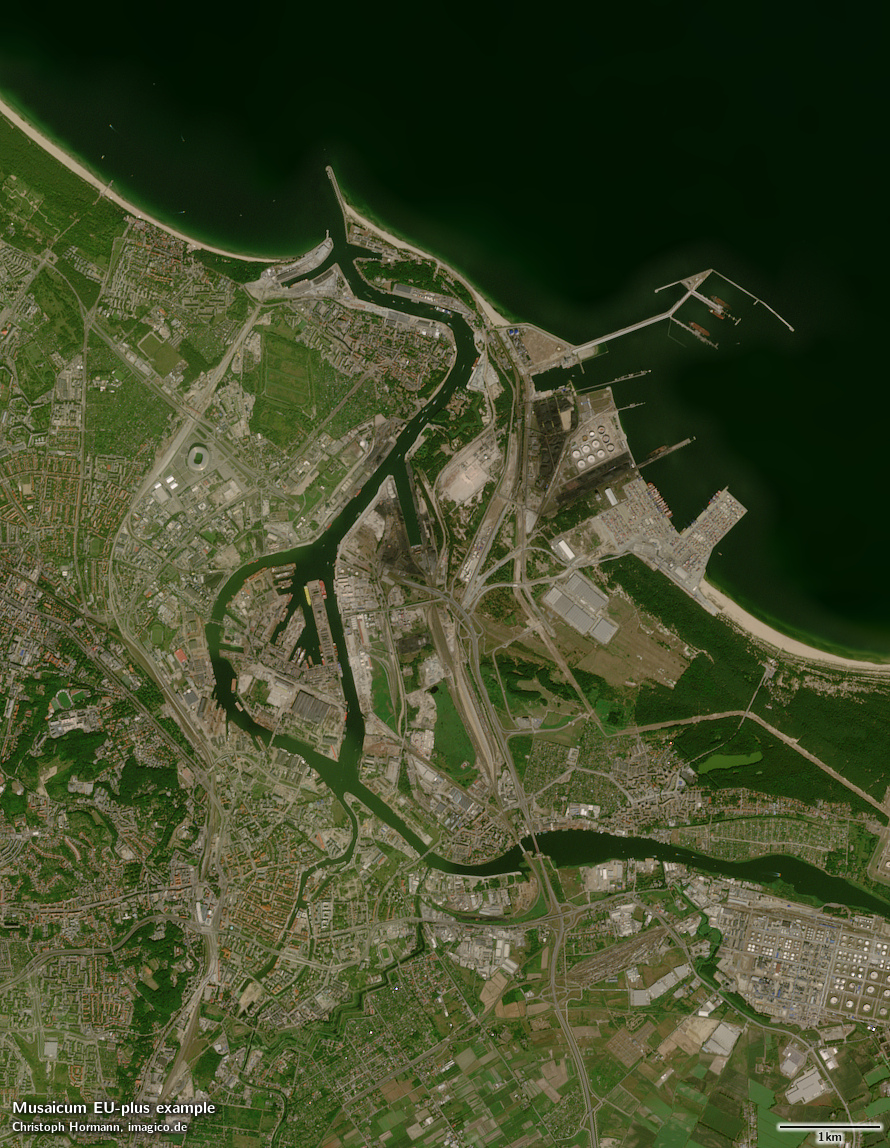
Gdansk, Poland
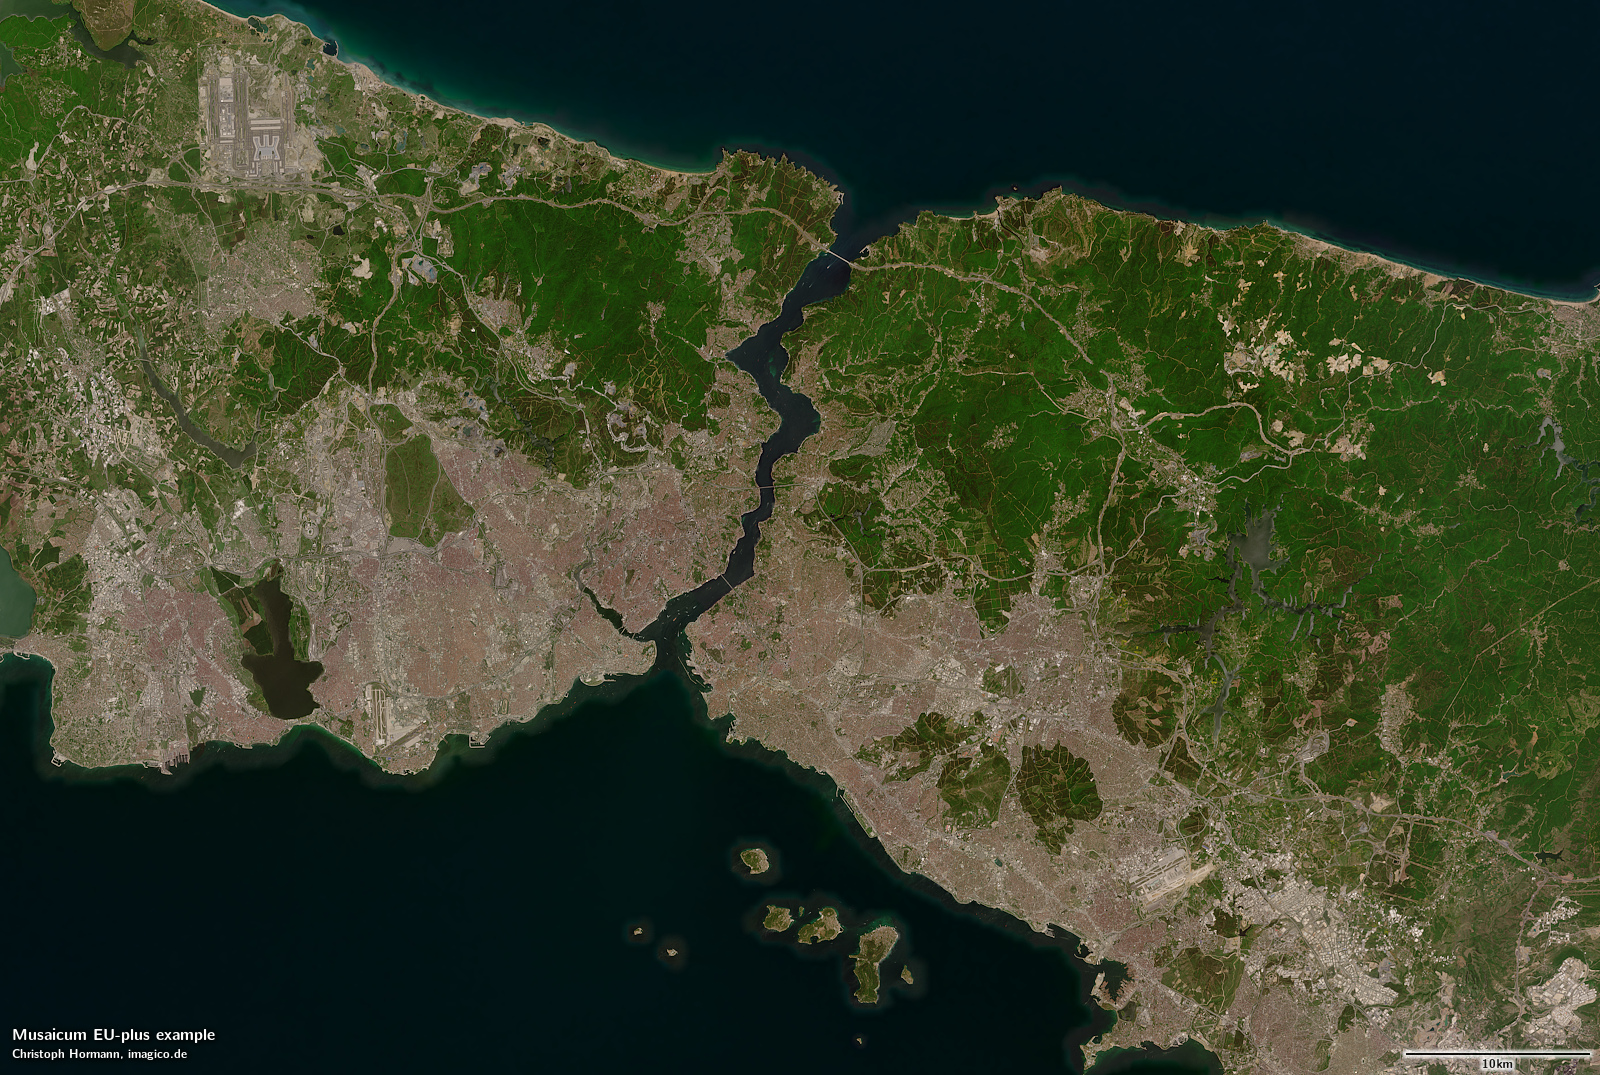
Istanbul, Turkey
A few words on the data used for producing the image. In analogy to the numbers i presented above for the Green Marble: The volume of original Sentinel-2 data processed for this project was about 20TB, which means it needed less than 250 bytes per pixel. This is extremely sparse considering that the volume of Sentinel-2 data collected for Europe within a single year alone is much higher. A low volume of data to process helps keeping the processing costs low and it also allows using more expensive processing techniques. And in contrast to pixel statistics methods where adding more data always helps, there is no advantage per se with classical mosaicing techniques to use more data, it is more a quality over quantity thing.
What has been more challenging is that i wanted to keep the time-frame from which to source data from relatively short. Preferably just three years (2020-2022), where necessary another year (2019) and only in rare cases also data from 2018 is used. In areas where the earth surface appearance is very volatile – either across the seasonal cycle or between years – this makes it difficult to produce homogeneous results over larger areas.
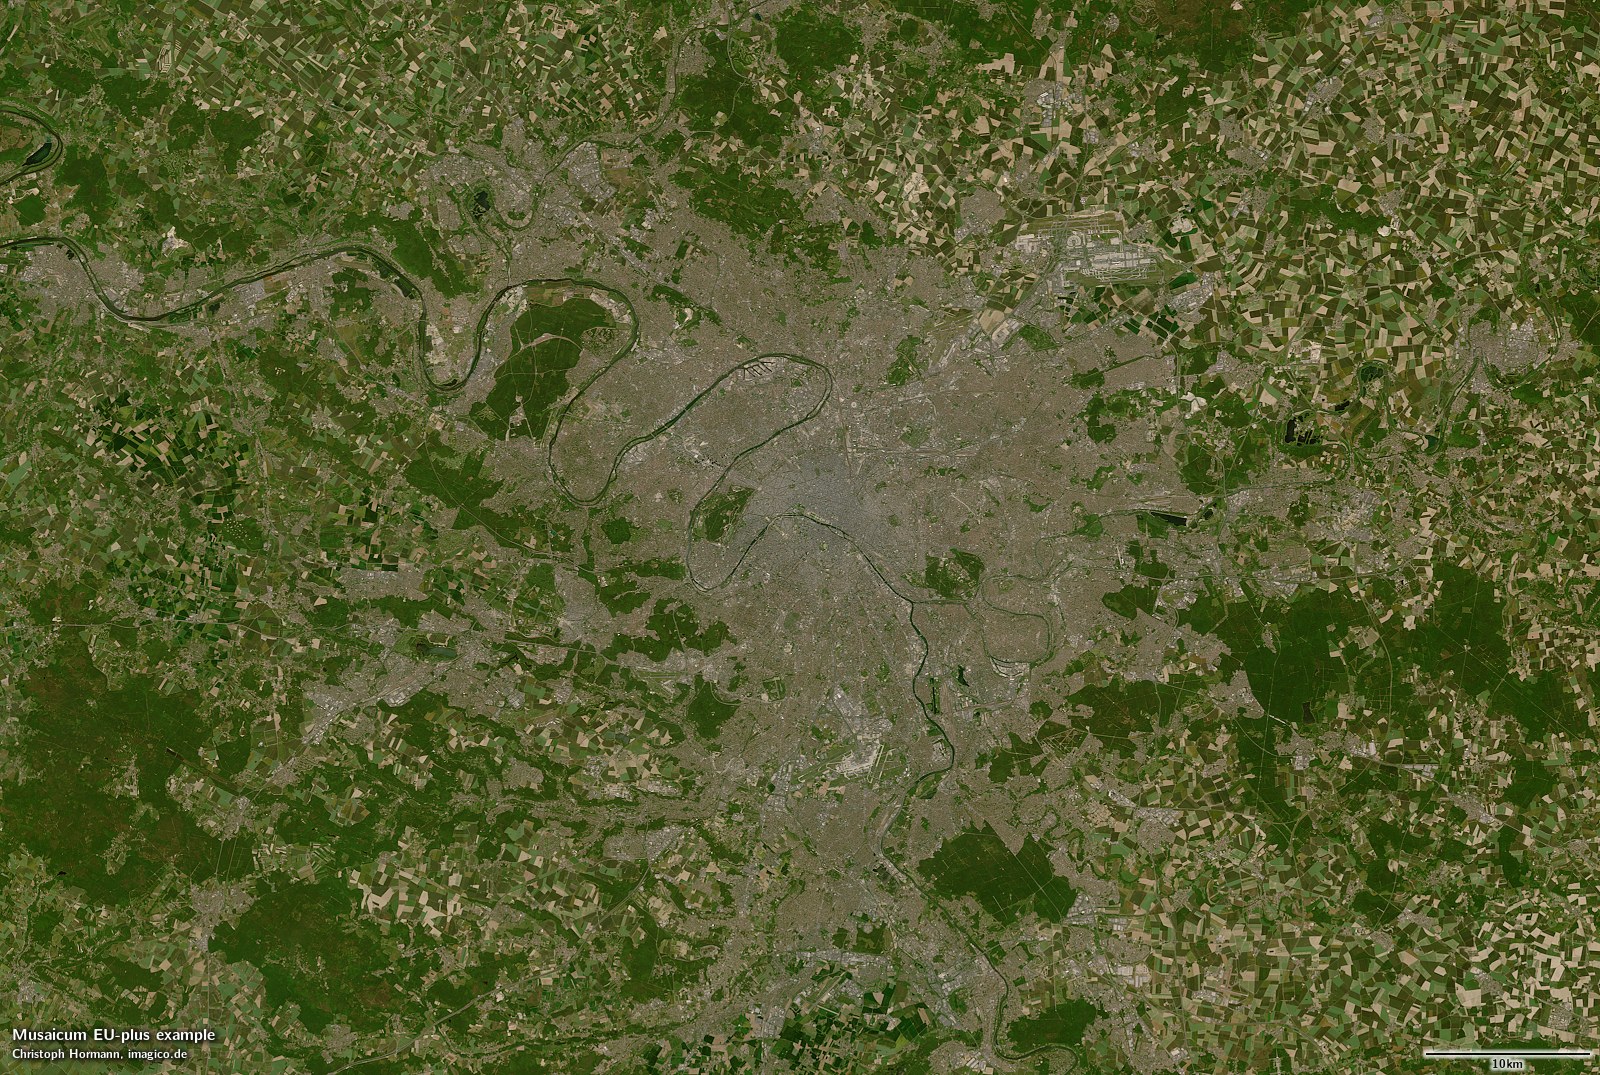
Paris, France
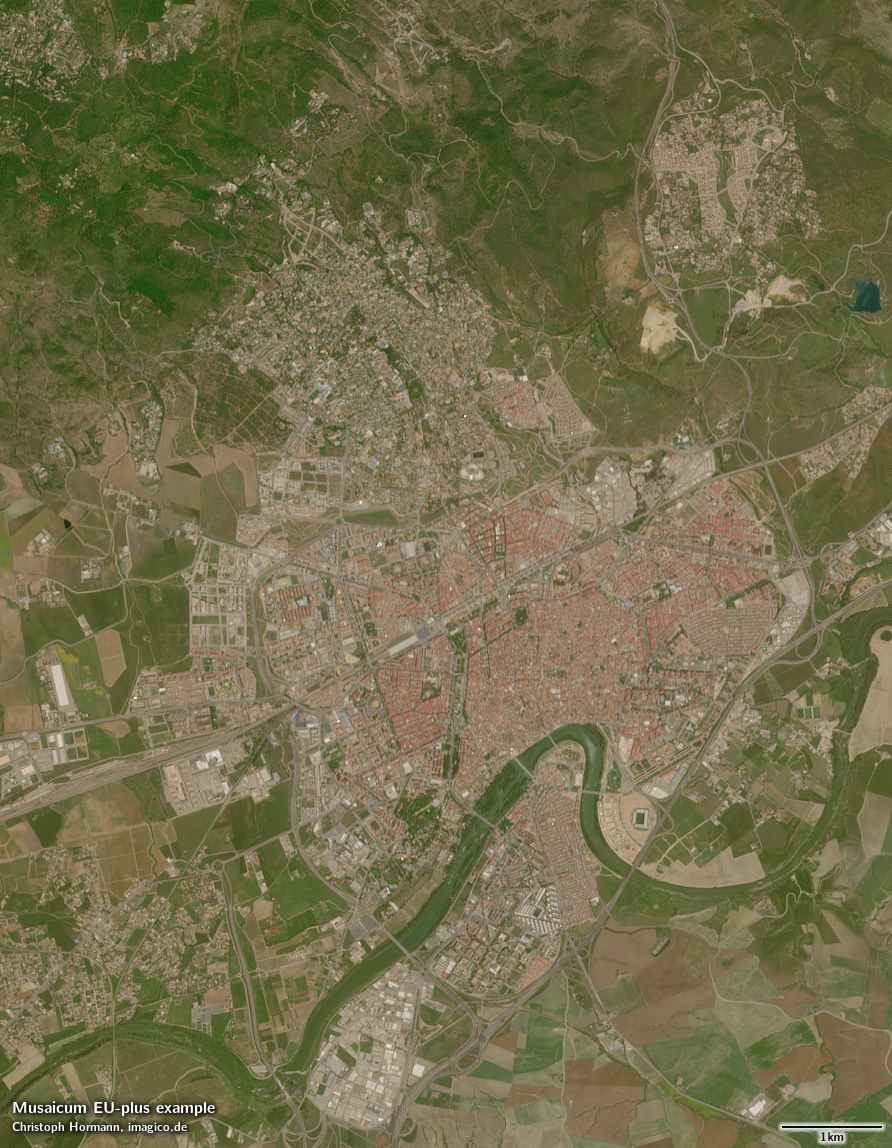
Cordoba, Spain
What you have to work with
One of the things that made work on this quite substantially harder than you would naively expect it to be is the poor quality of some of the data supplied.
Sentinel-2 data can be obtained in two different forms:
- L1C data – which is the original Top-of-Atmosphere reflectance values as recorded by the satellite
- L2A data – which is as estimate of the surface reflectance data based on the TOA measurements
Now most experienced users of satellite imagery will understand that the L2A data is – as i characterized it – just an estimate of the surface reflectance. And while this should reduce the variance due to the variable influence of the Earth atmosphere it will also introduce variance in the form of various forms of noise and systematic and random errors in the estimate. What, however, most data users will not realize is that the Sentinel-2 L2A data distributed also attempts to compensates for illumination differences (shading) and that this compensation – to put it bluntly – is incredibly bad. So bad that it is practically not usable for visualization purposes. Here an example – larger version is linked:
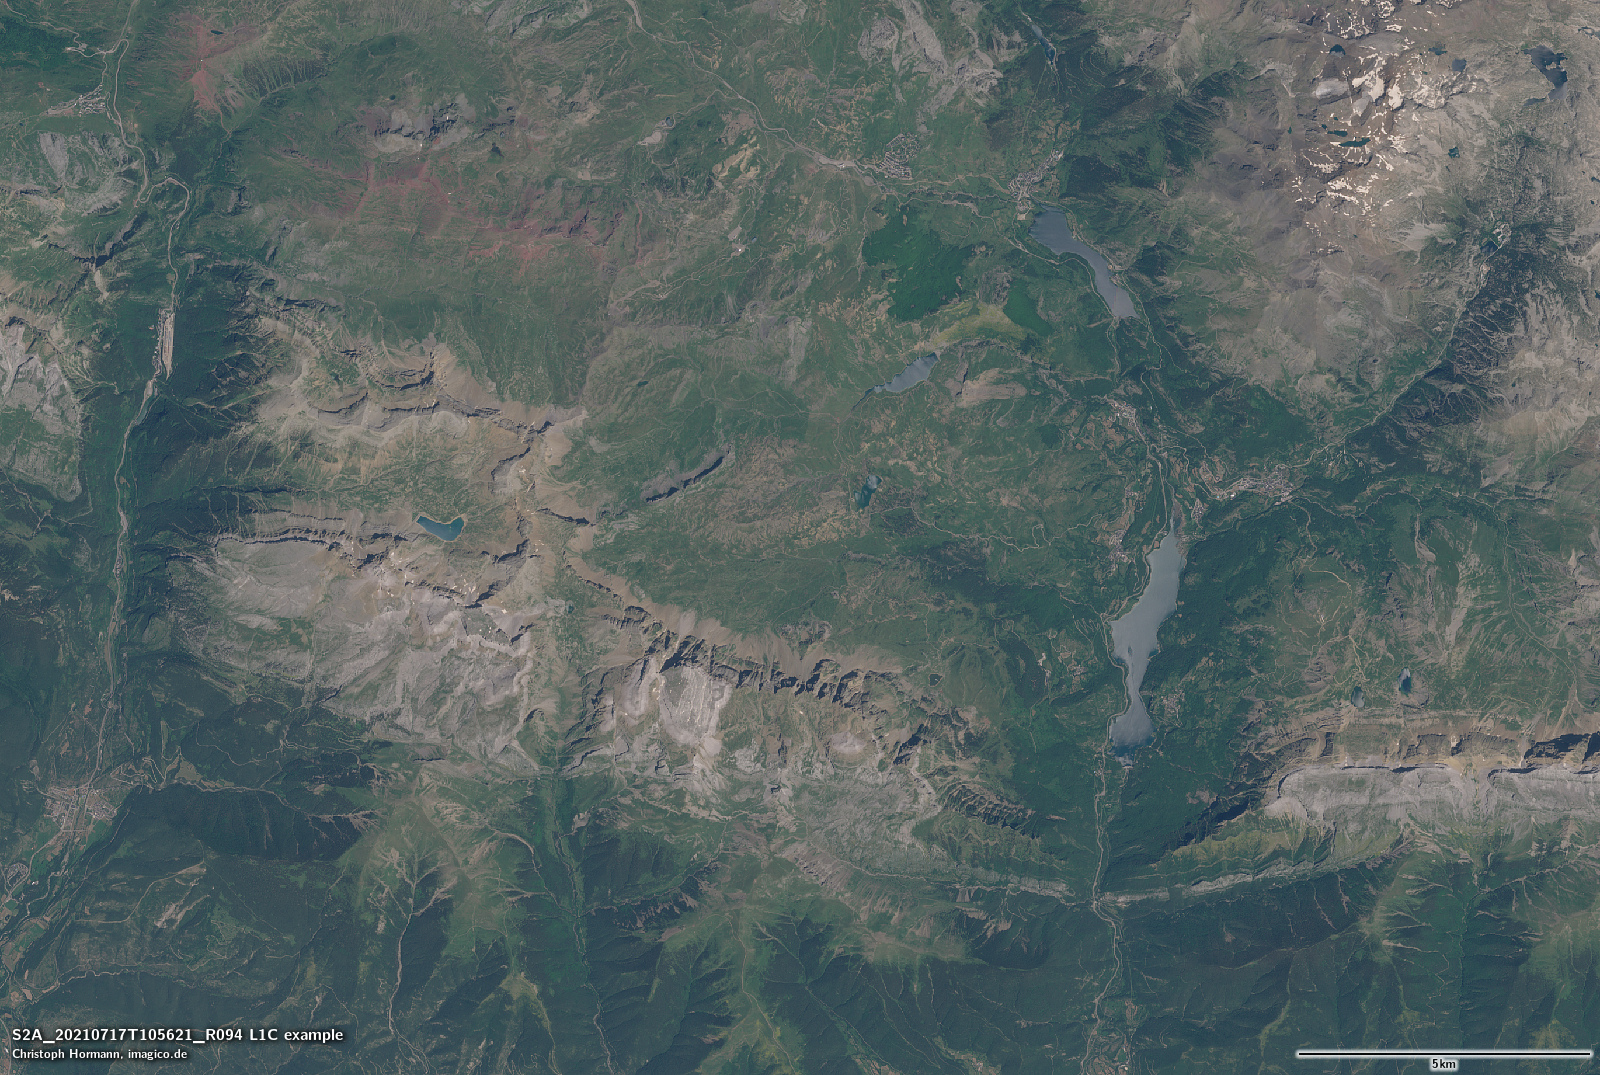
S2A L1C from 2021-07-17
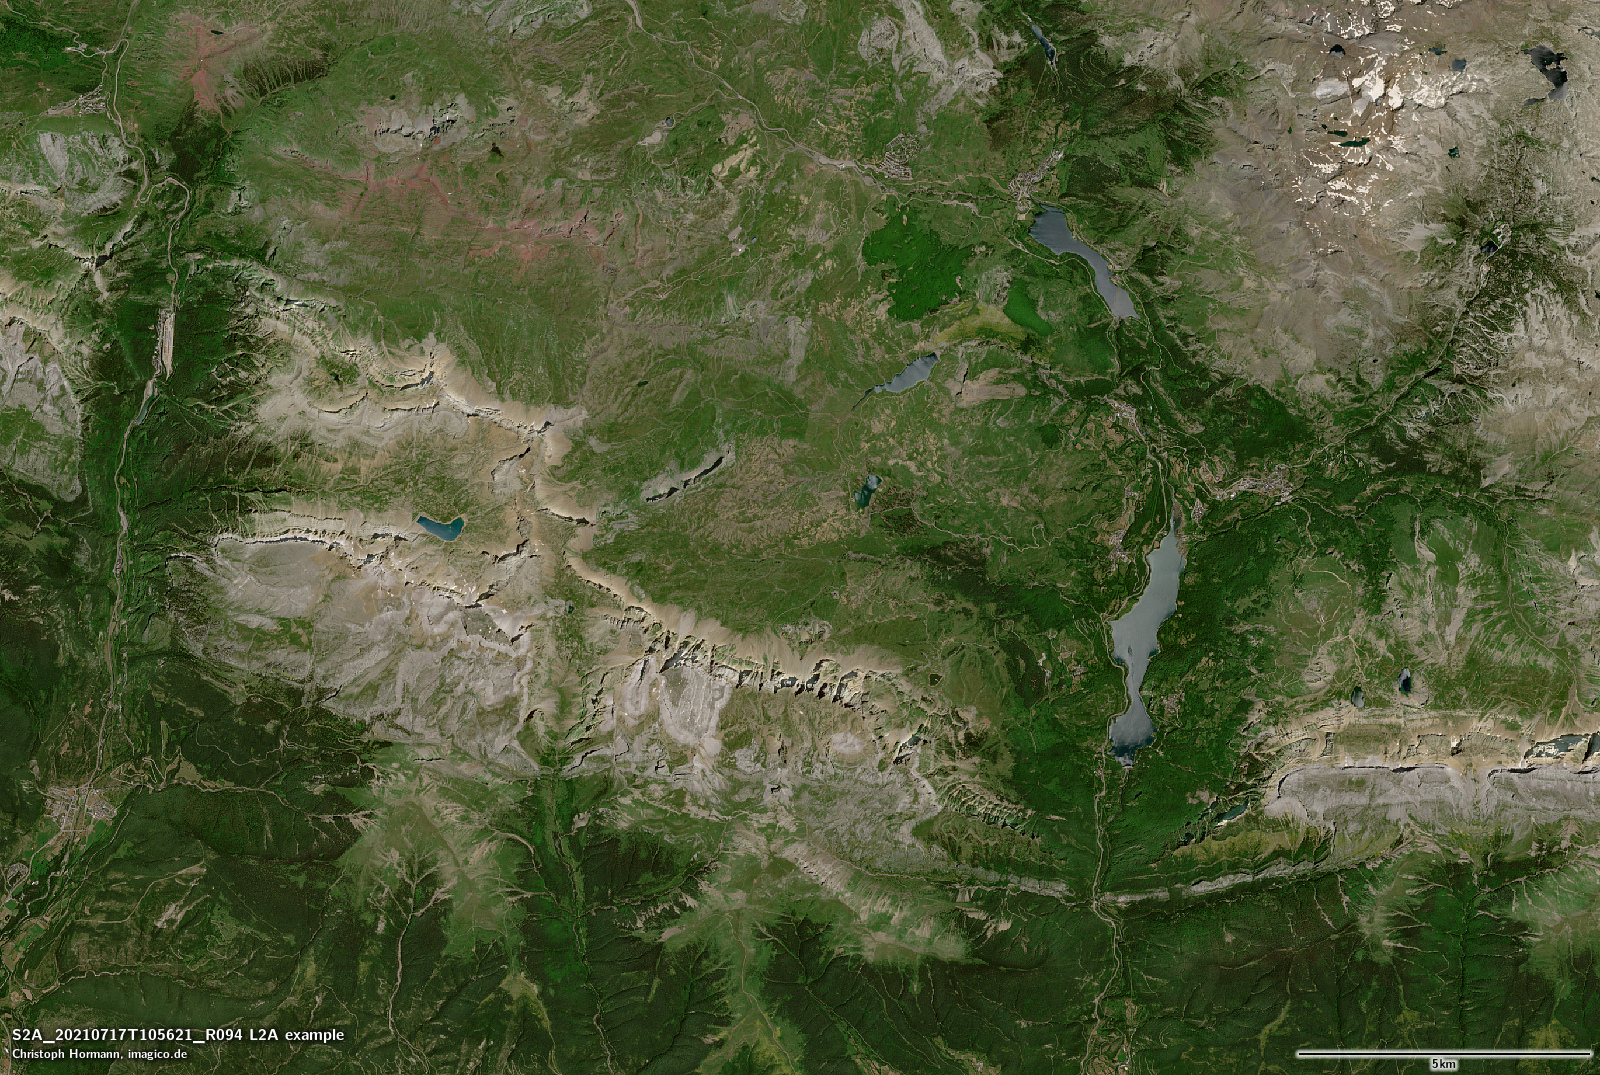
S2A L2A from 2021-07-17
For comparison here the new Europe mosaic (which in the default rendering is an atmosphere but not shading compensated version) and my own shading compensated version. For most of the sample area the mosaic is based on the same recording – except for the top right where the July image contains residual snow so the mosaic uses a later season image.
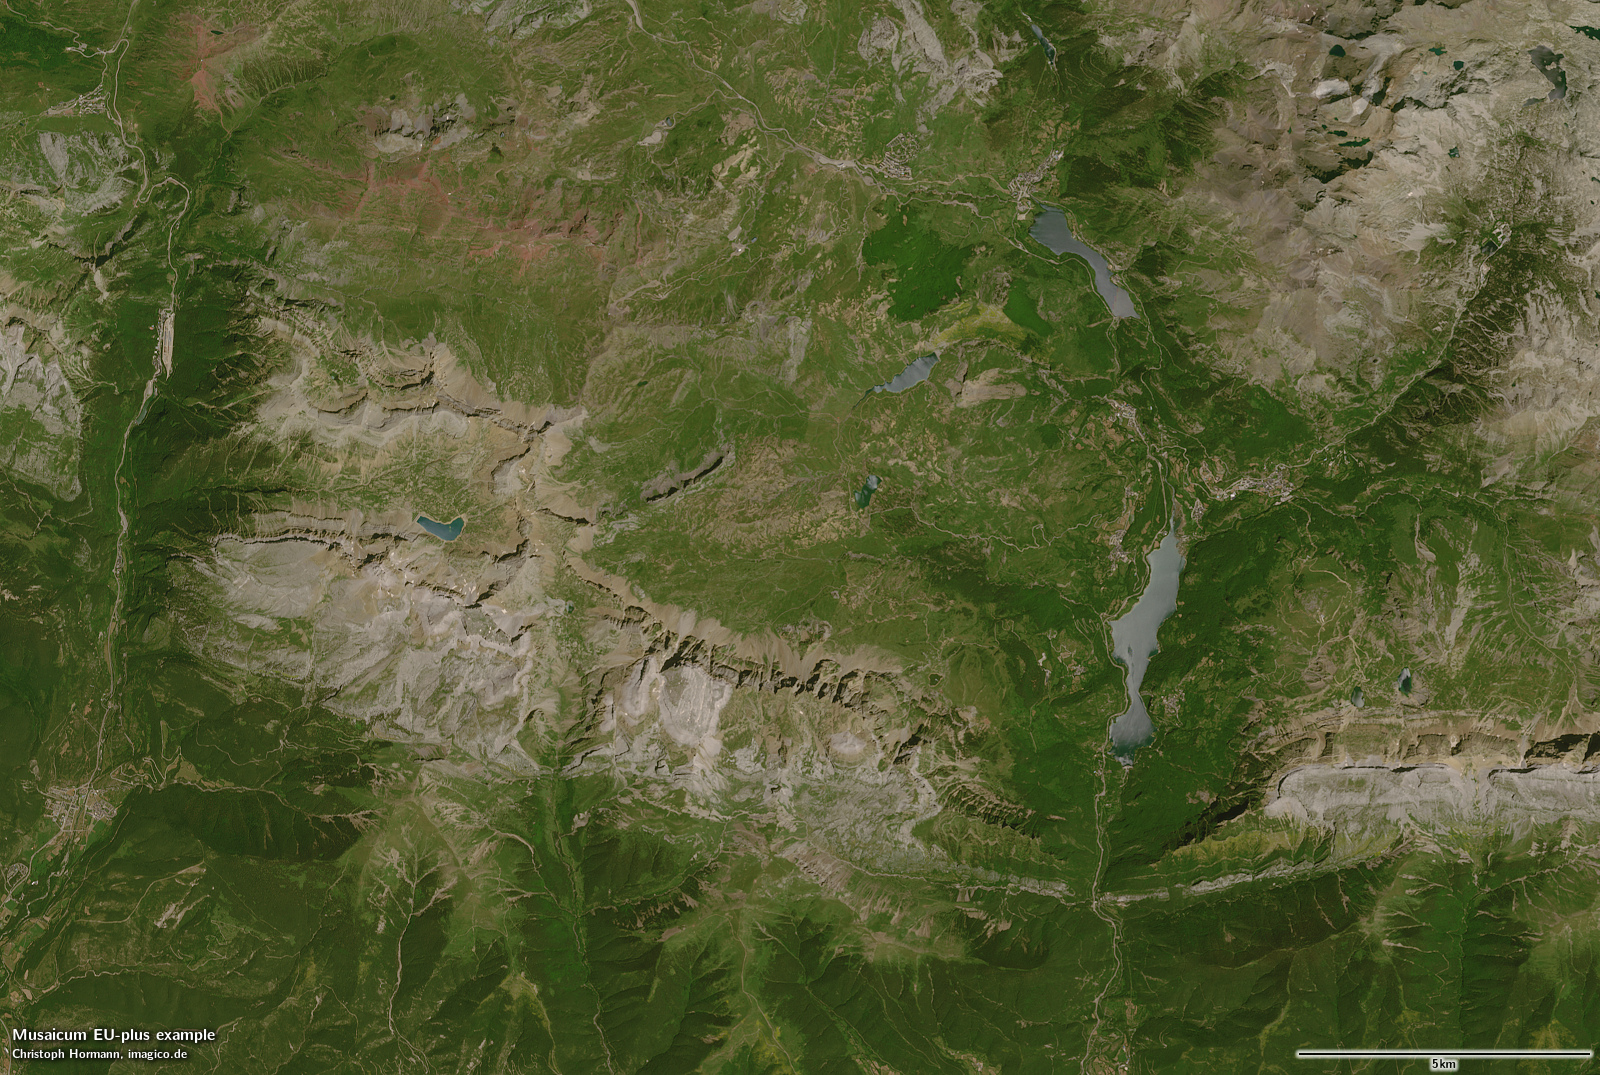
The new Europe mosaic – Tena Valley, Pyrenees
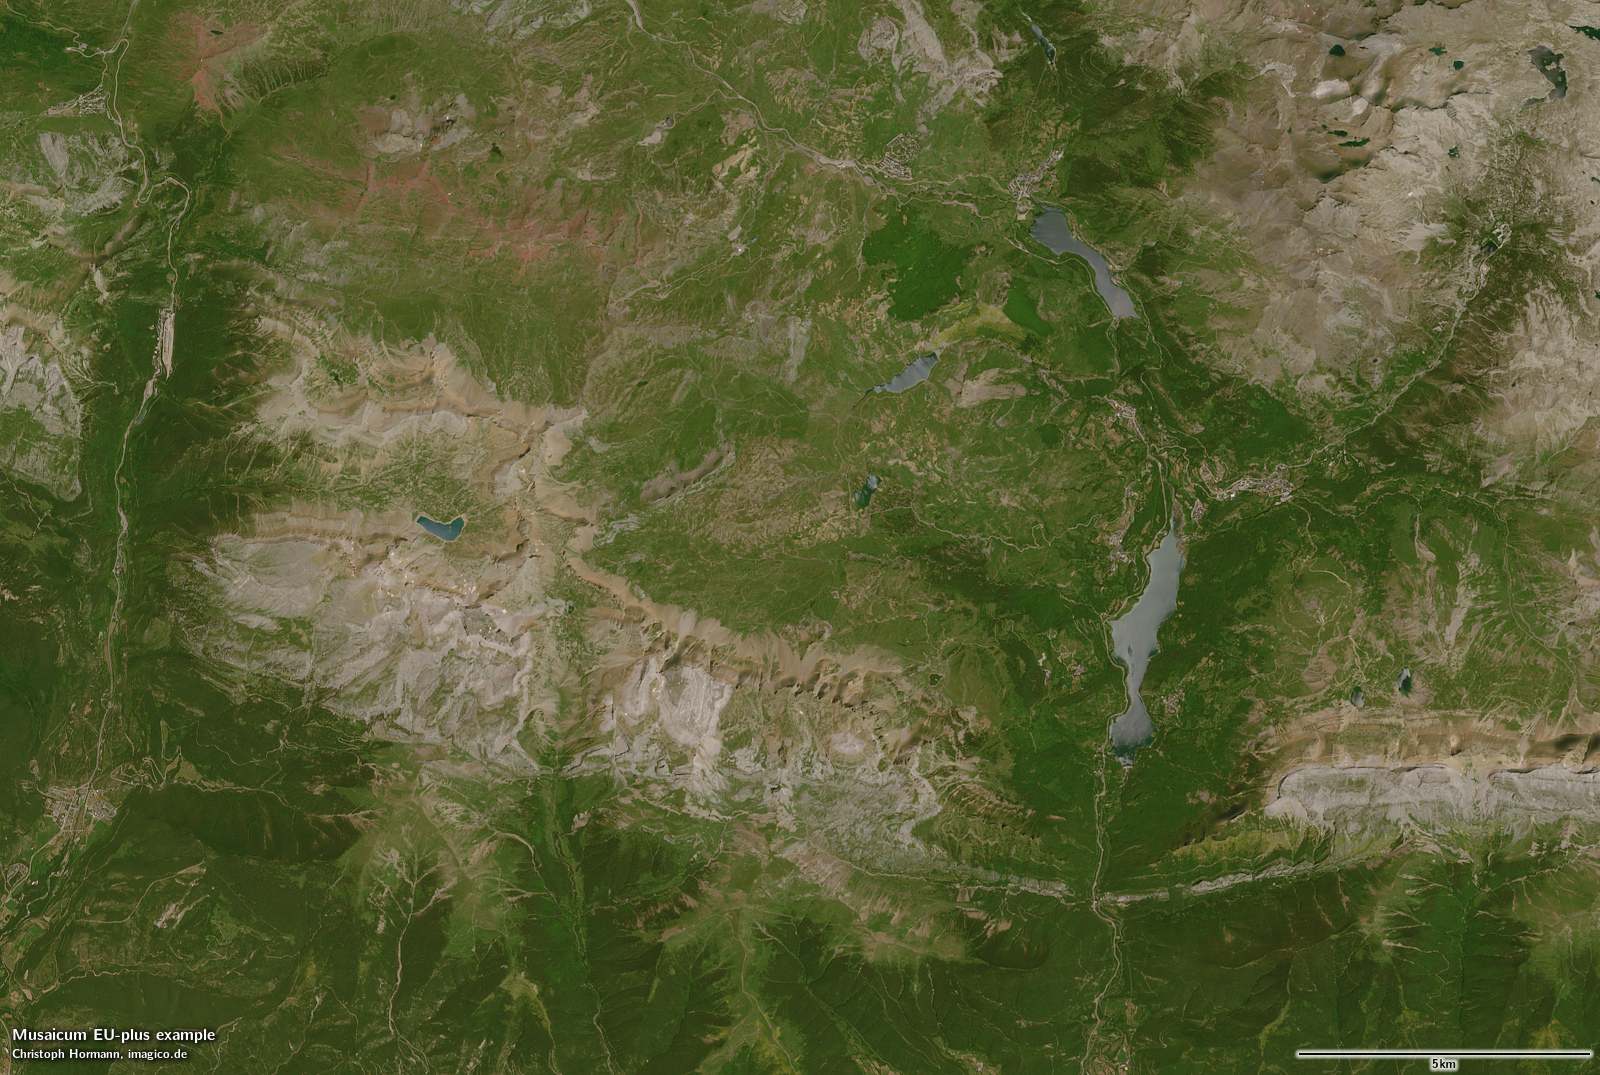
Shading compensated version
The overall color difference is not the main point here (the tone mapping i applied to the L1C/L2A data is somewhat arbitrary). The main point is that the illumination compensation in the L2A data massively over-compensates, leading to the shaded slopes often being brighter than the sun facing slopes. Also it is geometrically fairly inaccurate, leading to a strong emphasis of ridges and the introduction of substantial amounts of high frequency noise.
There seem to be quite a few people using Sentinel-2 L2A data in visualization applications. That is not a good idea. You should only use shading compensated imagery in visualizations if you know exactly what you are doing and in that case you should use a proper method and not the hatchet job offered by ESA here.
I have discussed the matter of shading compensation, in particular for use in 3d rendering, previously. A shading compensated version is available for the Musaicum EU-plus as well – but i have not had the time for a proper evaluation yet. It is available on request.
What remains
As i have mentioned earlier – this is a first attempt at a more highly automated classical mosaicing process. As often with this kind of work many things remain unclear during process development and only become clear once you run the process at scale. This might sound a bit like undue perfectionism considering the results are pretty good. But this is not just about the quality of the results but also about the robustness and efficiency of the process. As a general rule of thumb for a project like this i would say: Putting as much work into process development after the first use at scale as before is reasonable if your aim is to make full use of the potential of the method used.
Svartisen, Norway
Where to go from here
One thing that i am sure quite a few of my readers are going to ask is: Does this also work beyond Europe? In principle the answer is yes, but there is more to it than just running it on another volume of data. Quite a significant part of the development work that went into this project was for tuning and adjusting methods and parameters for the specific settings in terms of climate and surface characteristics that can be found in the processed area. I know from experience with the Green Marble that the variety of different settings on Earth is larger than people usually expect. This needs to be taken into account and that was not part of this project.
There are a number of other additions and extensions of the project that i would like to work on, for example producing a vegetation map similar to the ones available for various local mosaics is is on the list. And of course over time there will be the question of updating the mosaic with newer data. I don’t know if and when i will have the capacity to do any of this. If any of the readers are interested in supporting further work on any of this please feel welcome to get in touch.
You can find the product description and more sample images on the Musaicum EU-plus product page.
Many thanks to Geofabrik for co-financing this project. If you are interested in tile services based on the the Musaicum EU-plus or the Green Marble, people at Geofabrik will be happy to help you. If you are interested in licensing the image for other purposes you are welcome to contact me.
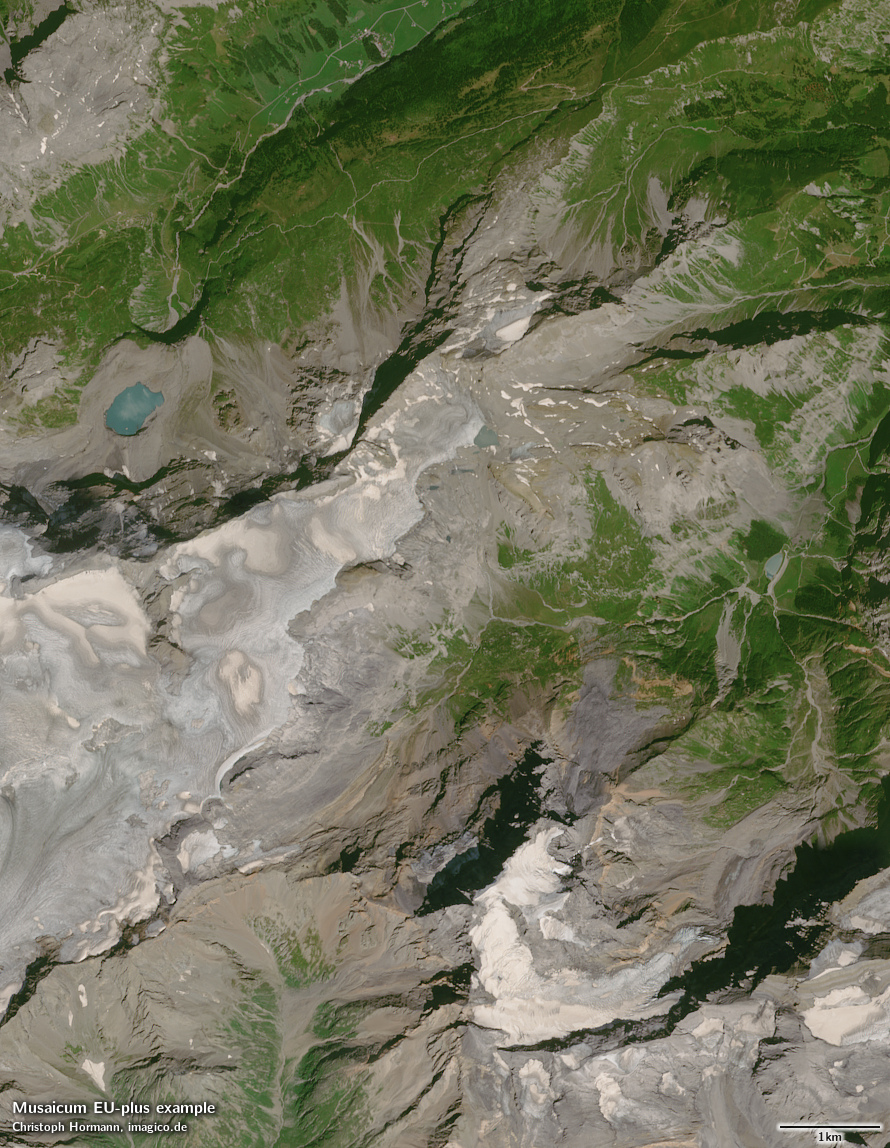
Tödi, Switzerland
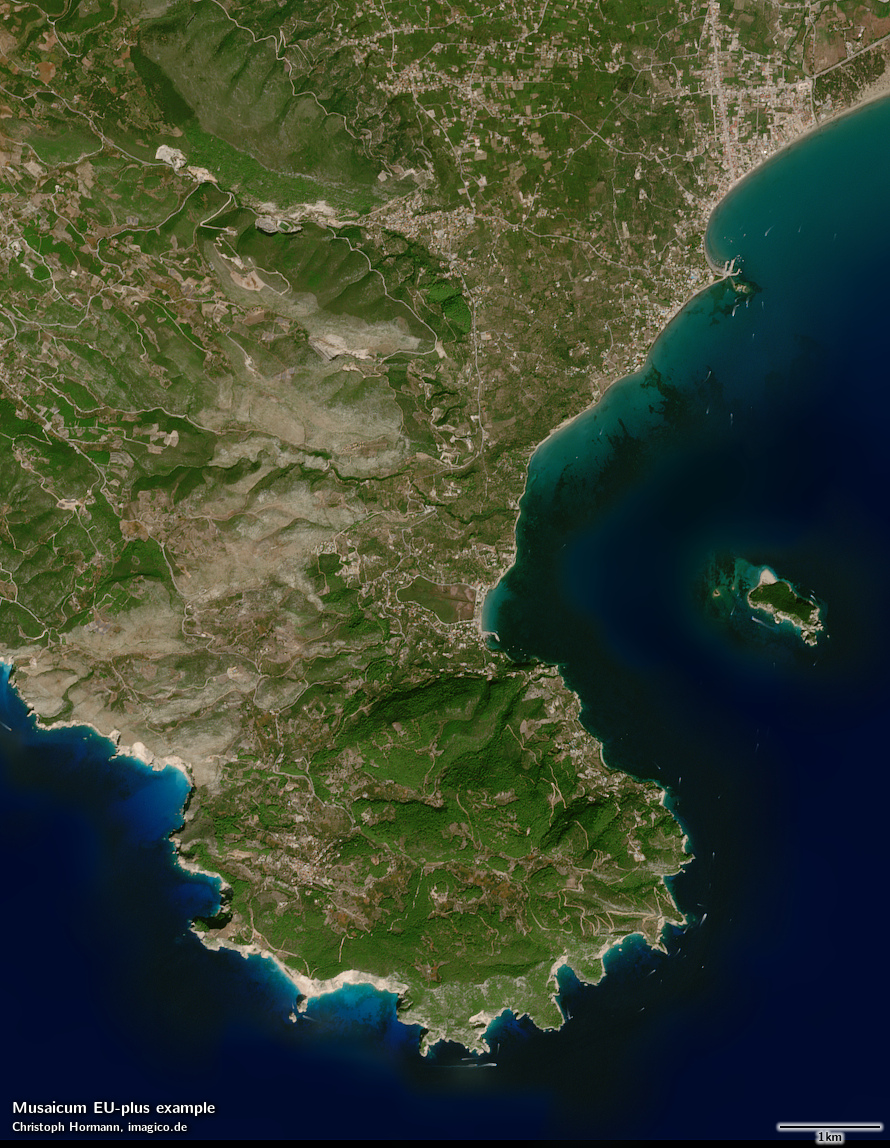
Zakynthos, Greece