
As i have indicated in my pre-AGM comment end of last year i intend to look at developments in the OpenStreetMap Foundation less on an acute level and regarding current events and more focus on long term developments, trying to help people better understanding those. This is the first post i am writing under that paradigm.
In 2019 i last looked at the membership structure of the OSMF and how much it represents the active mappers in OpenStreetMap in their geographic distribution. Since then others have analyzed the numbers as well – but i thought that after nearly five years having a look along the same lines as back then might be useful.
Now there are people who dismiss this kind of analysis as irrelevant because it is just about mapper representation and does not consider non-mapping contributors to OpenStreetMap. But in most cases this argument seems primarily used to justify a continuation of the existing cultural dominance in the OSMF. Because, evidently, non-mapping contributions to OpenStreetMap typically much more than mapping require knowledge and familiarity with the English language. So in my eyes, basing the geographic representation in the OSMF on the geographic distribution of mapping would be as close as it practically could get to a balanced representation of the OSM community in that regard overall.
The numbers used are taken from recently published data. Unfortunately the OSMF still has no automated regular reporting of membership statistics and i did not want to take up time from the MWG volunteers by asking them for numbers specifically for me. Keep in mind that there are different concepts of membership that can be analyzed – either the paid up members (those who are hypothetically eligible to vote in a general meeting at the moment) and all formal members (including ones in grace – that means who have last renewed their membership between one and two years ago and who are therefore still considered formal members despite not being eligible to vote).
Like in 2019 i put the OSMF memberships per country of residence in relation to OSM mapping contributor statistics published by Pascal Neis. With those – keep in mind that they are based on where mappers are active, not where they are from (which is typically not known). And since Pascal meanwhile publishes also estimates how many of the active mappers are part of organized mapping activities, i did my analysis separately for either all mappers or only the non-organized mappers.
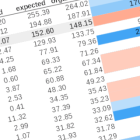
Otherwise, the columns are mostly identical to those in 2019:
- OSMF members: number of OSMF members from that country (normal and associate, paid and active contributors) according to data provided by the MWG
- Mappers/Day: average number of mappers from that country active per day according to Pascal’s statistics (averaged over the last 52 weeks)
- expected: expected number of OSMF members from that country assuming proportional representation and same total member count (1929)
- representation: percentage of actual representation compared to expected (100 indicates proportional representation)
- mismatch: difference between expected and actual number of OSMF members, negative values indicate too few members for proportional representation
Because the total number of OSMF members has significantly increased since 2019 the absolute numbers are a bit difficult to compare, it is mostly the representation numbers that can be looked at in that regard.
What i included in addition this time is the other countries not on the list where there are mapping activities but from where there are no OSMF members at all. This is the gray line. Of course for these the representation is zero.
Here are the numbers, sorted by average active mappers/day:

Representation of mappers in OSMF membership – 2024, link goes to larger version
Here a CSV file with the data from that table.
What i see when looking at the data is in particular:
- The strength of the over-representation of the most strongly represented countries has, overall, substantially decreased. If we exclude the countries with very few mappers and <5 OSMF members (for which the representation calculation is extremely inaccurate) there is only one country now with more than 300% representation (Luxembourg, 413%/402%) and the two largest countries - both in terms of mapping and in terms of OSMF membership numbers (Germany and US) - have both decreased in their over-representation (the US very strongly, Germany somewhat less). The UK is on exactly the same level as in 2019 (254%) while the Netherlands have increased quite a bit (from 170% to 207%).
- More importantly the representation of the most severely under-represented countries in 2019 (Poland, Indonesia and Russia) has increased substantially. This is most impressive for Poland (8% to 75%) but also for Indonesia (9% to 29%, 34% if you exclude the organized mapping activities). Russia went from 11% to 28%.
- The most under-represented single countries with a large number of active mappers now are Russia, China and Iran. Japan has more or less retained its level of representation, but is still quite low among the more active countries with 41% representation.
- The most important observation is the same as in 2019 – that the countries with relatively small mapping activity (the long tail) are collectively severely under-represented. This is most obvious in form of the line for ‘others’ – which represents all the countries with no member in the OSMF at all. These countries together, based on their mapping activities – would deserve about 150 seats in the OSMF membership based on their mapping activities.
The most significant factor that has influenced the representation in the past years is without doubts the active contributor memberships that remove the hurdle of needing to pay for being an OSMF member.
This just as a quick look, readers should do their own observations and draw their own conclusions of course. Feel welcome to comment with your thoughts below.
All of this is of course only on the subject of geographic representation. And even if this aspect is further improved and we’d ultimately achieve a proportional representation of the whole OSM community also in other aspects that is no guarantee for the OSMF being run according to the needs of the community.
A big issue, which i already hinted at by separating the organized mapping activities, is the over-representation of people with an OSM related business or career interest. Among mappers this is more or less equivalent to organized mapping – and although we have no fully reliable data on which mapping activities belong to that, thorough analysis of mapping behaviour can provide a good estimate. We do not, however, have any reliable information on which OSMF members have OSM related business or career interests. What we can see meanwhile is that among people active in the OSMF in a form visible to the outside observer (both volunteers out of their own initiative as well as among members of appointed bodies) the hobbyists are clearly in a minority now and their percentage is further decreasing. But if this can be extrapolated to the OSMF membership is not quite clear. If this is the case then that might be a more severe representation problem than the geographic distribution. If not the mismatch between the social structure of the OSMF members and people active in the OSMF is likely to create problems on its own.