Back in July i introduced the Musaicum EU-plus – a 10m resolution satellite image mosaic of Europe. I have now finalized two additional variants of this image that i would like to introduce here.
Both of them are fairly specialized data sets, therefore i did not so far list them in my products. I mostly produced these for my internal use in the production of my own higher level visualization products. But they are also available for external use on request.
Shading compensated image mosaic
I already provided a preview for this when introducing the standard mosaic in July. In addition to the standard surface reflectance image product, i am offering also a shading compensated version. This is not based on the very poor quality L2A data provided by ESA but uses a custom algorithm developed by me specifically for visualization applications.

Musaicum EU-plus shading compensated in the Western Alps – click for larger version, original, not shading compensated for comparison

Musaicum EU-plus shading compensated in the Pyrenees – click for larger version, original, not shading compensated for comparison
This shading compensated version of the mosaic has now been produced and evaluated for the full coverage area of the Musaicum EU-plus.

Musaicum EU-plus shading compensated – coverage area
Vegetation and water map
In addition to the visual color images i also produced a fractional landcover data set with the same grid specifications – comparable to similar data sets i had produced for regional mosaics before.
This data specifies the fractions of a pixel covered by
- herbaceous vegetation
- woody vegetation
- water
- bare ground
Visualized using different colors for the different landcover classes this looks like the following:

Fractional landcover data visualization – Western Alps

Fractional landcover data visualization – Pyrenees
This data is likewise available for the full coverage area of the Musaicum EU-plus but should be regarded more experimental w.r.t. the herbaceous/woody vegetation, in particular at higher latitude where low sun angles and the resulting differences in illumination make a consistent classification difficult.
Application examples in maps
Here a few examples how this new data can be used in map production. These are in web mercator projection at z13 and z12.

Musaicum EU-plus image – click for larger area

Musaicum EU-plus shading compensated with artificial northwest shading – click for larger area

Musaicum EU-plus shading compensated with artificial northwest shading and contours – click for larger area

Landcover rendering based on Musaicum EU-plus fractional landcover layer – click for larger area

Musaicum EU-plus image – click for larger area
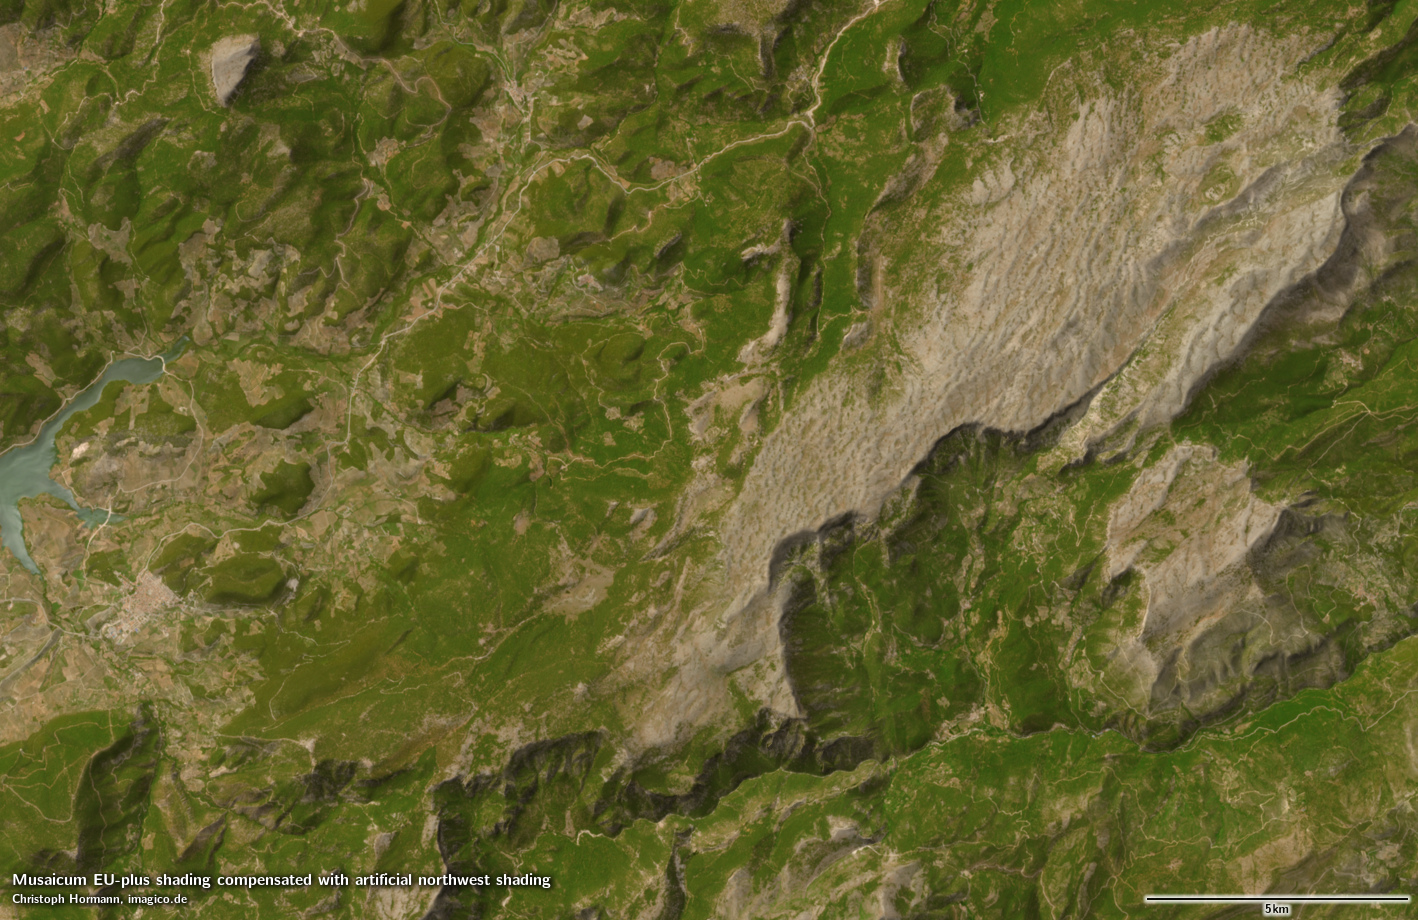
Musaicum EU-plus shading compensated with artificial northwest shading – click for larger area

Musaicum EU-plus shading compensated with artificial northwest shading and contours – click for larger area

Landcover rendering based on Musaicum EU-plus fractional landcover layer – click for larger area

Musaicum EU-plus image – click for larger area

Musaicum EU-plus shading compensated with artificial northwest shading – click for larger area
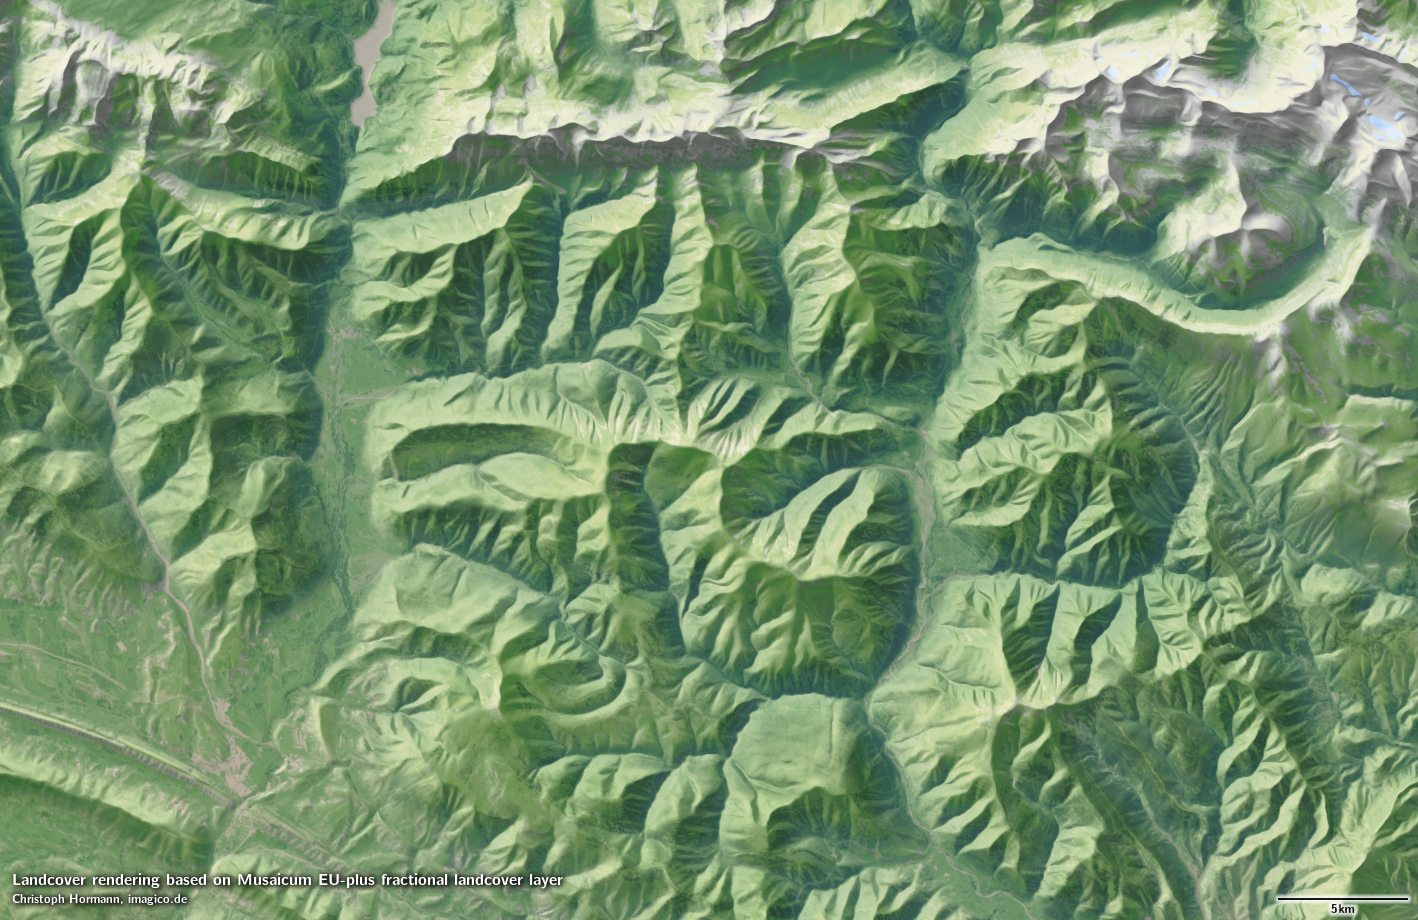
Landcover rendering based on Musaicum EU-plus fractional landcover layer – click for larger area
Application examples in 3d
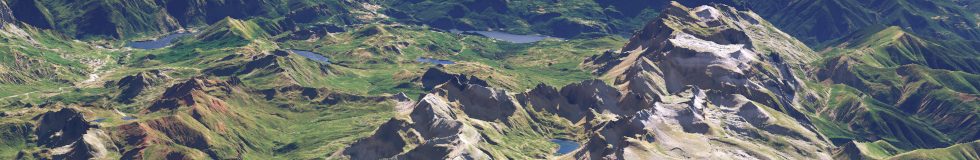
One of the main uses of the shading compensated imagery is of course the production of 3d views with a freely adjustable lighting independent from the light direction when the images were taken. Here a demonstration of that.

Pyrenees with early morning lighting

Pyrenees with afternoon lighting
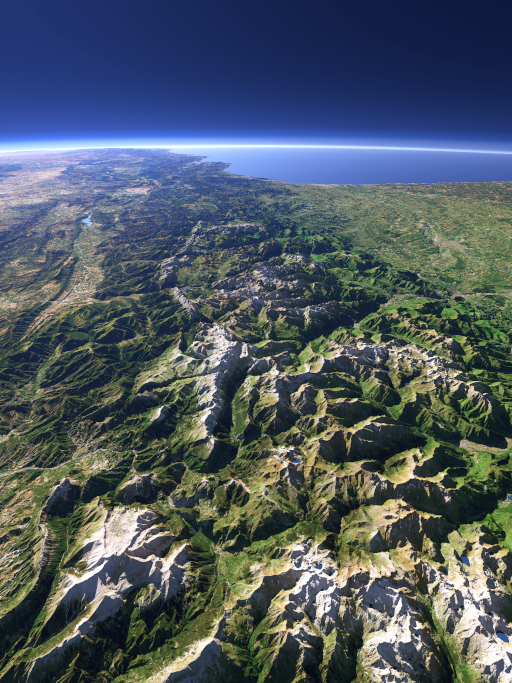
Pyrenees with late afternoon lighting
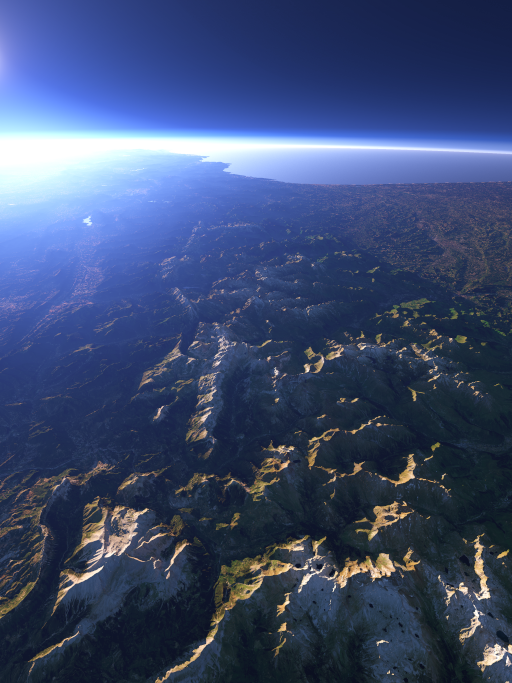
Pyrenees with evening lighting
And another example from the Alps – compare also to this older view.

Bernese and Uri Alps with afternoon lighting

Bernese and Uri Alps with morning lighting
Further 3d rendering examples:

Ordesa Valley, Pyrenees

Pennine Alps, Italy/Switzerland

Mt. Etna on Sicily, Italy
Apart from the Musaicum EU-plus these visualizations are using data from: OpenStreetMap contributors – ODbL, L’Institut national de l’information géographique et forestière (IGN) – Licence Ouverte 2.0, Istituto Nazionale di Geofisica e Vulcanologia (INGV) – CC-BY 4.0, Bundesamt für Landestopografie (swisstopo), Centro Nacional de Información Geográfica (CNIG)
Pingback: weeklyOSM 704 – weekly – semanario – hebdo – 週刊 – týdeník – Wochennotiz – 주간 – tygodnik